AUTOMATIC GRAPH LAYOUT TECHNIQUES
This section introduces the automatic graph layout techniques used in our system to ensure that a web graph layout fits in the display window and has no overlaps.
The most difficult editing function for a web graph is layout ” assigning a position for each node and a curve for each edge. The assignment must make the resulting picture easy to understand and easy to remember. A good layout can be like a picture ” worth a thousand words; a poor layout can confuse or mislead the user. This problem is called the graph drawing problem ” how to automatically create a nice layout. Automatic layout can free the user from the time-consuming and detail- intensive chore of generating a readable diagram. However, most existing systems that incorporate diagrams, such as CASE tools, do not support automatic layout; the layout decisions in these systems have to be made by the user, using the mouse and the screen to replace pen and paper.
Most classical graph drawing algorithms (Battista et al., 1998) produce aesthetically pleasing abstract graph layouts. These algorithms can be applied to draw practical graphs as long as the size of nodes take very little space. This is because such algorithms were often designed for abstract graphs where nodes take up little or no space.
However, in applications, the images of nodes are circles, boxes, diamonds and similar shapes ; they may contain a considerable amount of text and graphics. In some systems (see Eades & Lai, 1991; Harel, 1988; Lai & Eades, 1995; Purchase, 1998), nodes are used to represent sub-graphs and may be quite unpredictable in size and shape. Applying such algorithms to practical graphs may result in overlapping nodes and/or edge-node intersections. Algorithms which exemplify this problem can be found in Eades (1984) and Kamada and Kawai (1989). They generate symmetric and well spread out diagrams which have great potential for use in the visualization of network structures. However, nodes of nontrivial size in a diagram produced by these algorithms tend to overlap.
We are interested in the problem of how to display diagrams, i.e., how to lay out practical graphs in applications. The term abstract graph layout refers to layout techniques for abstract graphs where nodes are negligible in size. The term practical graph layout refers to layout techniques for practical graphs where nodes vary in shape and size.
Our approach is to make use of existing classical graph drawing algorithms, i.e., to apply a classical graph drawing algorithm to a practical graph. Then, we need to develop some post-processes to avoid overlaps of node images and edge-node intersections by rearranging the graph layout (see Eades & Lai, 1991; Lai & Eades, 2002). The techniques for adjusting a graph layout should preserve the mental map of the original graph (see Eades et al., 1991; Misue et al., 1995).
The critical part of our approach is to remove overlapping nodes. We use the techniques for removing overlaps of node images and edge-node intersections (see Eades & Lai, 1991; Lai & Eades, 2002). We have experimented with these techniques using many sets of overlapping nodes and have found that it is quite effective. An example is shown. Figure 8 shows a graph layout generated by an abstract graph layout algorithm (the "spring" algorithm (Eades, 1984)). Figure 9 shows the result of replacing the nodes with rectangles, which gives us not only the overlapping nodes but also the edge-node intersections.
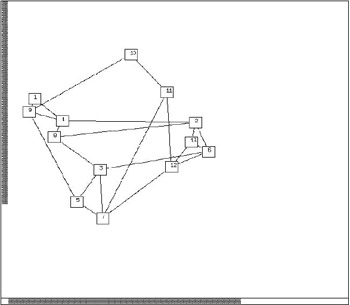
Figure 8: An Abstract Graph Layout
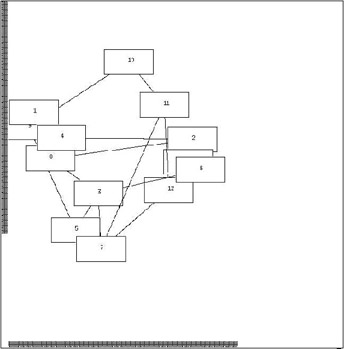
Figure 9: A Practical Graph
Figure 10 is the result of applying the "force-scan" algorithm (Lai & Eades, 2002) for removing overlaps of node images and edge-node intersections.
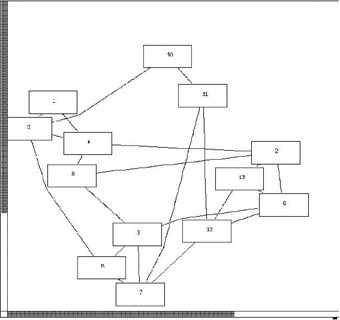
Figure 10: Layout Adjustment
Although these techniques can make nodes in a diagram disjoint and as compact as possible, they cannot guarantee that the size of a diagram fits in the display window. So, we must also solve this problem. To this aim, our layout adjustment includes the following three parts :
-
Use the techniques (Lai & Eades, 2002) to remove overlapping nodes and edge-node intersections.
-
If the size of the diagram exceeds the viewing area, find the minimum size diagram by changing the sub-graph layout.
-
If the diagram still exceeds the viewing area, let some sub-graphs become invisible (in the order of those which overlap the user's currently selected sub-graph).
We used Java as the major software development tool for the implementation of our system. A prototype of the web graph user interface for WWW navigation has been developed.
EAN: N/A
Pages: 171