11.11 Monitoring Exchange
|
| < Day Day Up > |
|
You can take two approaches to monitoring Exchange. If you operate a small to medium organization, the standard tools included in the ESM "Monitoring and Status" node are enough to get the job done. On the other hand, if your organization spans more than 20 or so servers, you may find it more efficient to purchase and deploy specialized monitoring software, such as Microsoft Operations Manager, NetIQ AppManager, or HP OpenView. The situation becomes more complex when you need to manage multiple applications or multiple platforms, and these issues will be a major influence over your final choice. In this section, we discuss the standard tools built into ESM, and then move on to look at specialized monitoring software.
The "Monitoring and Status" node of ESM replaces the server and link monitors supported by Exchange 5.5. This subsystem allows administrators to:
-
Set up email or script notifications for events that have occurred on monitored servers.
-
Display the status of the servers and connectors within the organization.
Figure 11.58 illustrates the basic working environment. Notifications display the monitoring activity performed by this server, together with the notifications that the server executes when problems occur. The Status node reveals the information about the servers and connectors visible across the organization. You can think of the connector information as being roughly equivalent to a basic snapshot of the routing table or the information you can see through the WinRoute utility.
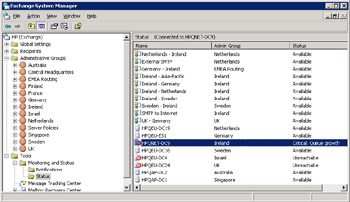
Figure 11.58: Viewing the status of servers and connectors.
You connect to a server to retrieve information, and ESM displays the name of the currently connected server at the top of the right-hand panel. If you run ESM on a server, it becomes the default connection for monitoring. If you have administrative permission on another server, you can use the "Connect to" option in the Status node to connect to that server and view the monitoring and status information available to it. Although refreshed at frequent intervals, status information is largely static. You can elect to refresh the information at any time by right-clicking on the Status node and selecting the refresh option. This forces ESM to rebuild its view from the routing table and the AD configuration information. Behind the scenes, ESM fetches the data using Exchange WMI providers. Connector information comes from the routing table via the ExchangeRouting- TableProvider, while server status comes via the ExchangeClusterProvider provider.
In Figure 11.58, you can see that several servers are marked as "Unreachable." This does not mean that the servers are down. Instead, this status indicates that the server we are connected to (HPQNET-DC9) is unable to contact the servers for some reason, perhaps a transient network condition that prevents our server from contacting the target servers. Essentially, Exchange attempts to ping a server to discover if it is active and reports that its status is "unreachable" if the ping fails. We can also see that ESM reports a server to be in maintenance mode. This happens when an administrator changes the properties of a server through ESM to disable reporting.
Use the following checklist to help determine the source of the problem if you see a server in an "Unknown" or "Unreachable" state and you know that the network is available and the server is running:
-
The System Attendant service is not running.
-
The Routing Engine is not running.
-
The WMI service is not running.
Figure 11.59 shows what you see if you select a server from the list and examine its properties. The default action is to list the resources currently monitored on the server. If you have Exchange Administrator permission for the server, you can disable monitoring on the server by setting the appropriate checkbox. In this case, we simply review what level of monitoring the server performs by clicking on the only item in the list of monitored resources, which happens to be a set of essential Exchange services that must run on a server. You can also select an item in the list and click on the Detail button to view the same information. As you can see, ESM defines the set of essential Exchange services as:
-
The Information Store (MSExchangeIS)
-
The MTA (MSExchangeMTA)
-
The System Attendant (MSExchangeSA)
-
The Routing Engine (RESvc)
-
The Windows SMTP service (SMTPSVC)
-
The World Wide Web (IIS) publishing service (W3SVC)
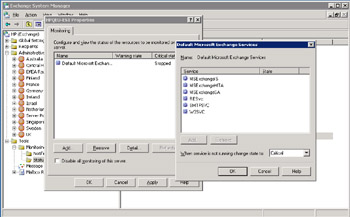
Figure 11.59: Viewing the monitoring properties for a server.
Apart from the set of essential services, we can add other resources for Exchange to monitor. Figure 11.60 shows the available resources (virtual memory, CPU, disk space, SMTP queues, another Windows service, and the X.400 queue). After you select the resource you want to monitor, you then set the monitoring criteria. Exchange stores monitoring settings along with the rest of its configuration data in the AD. Figure 11.61 illustrates how ESM flags problems. The HPQNET-DC9 server reports that a queue (either SMTP or X.400) has reached a critical limit.
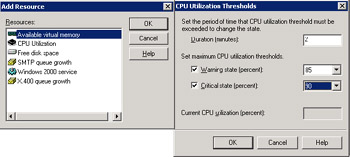
Figure 11.60: Adding a new resource to monitor.
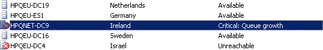
Figure 11.61: Critical queue.
ESM is not a purpose-designed monitoring utility and now it begins to display some flaws. We know that a problem exists on a server, but double- clicking on the problem server does not reveal any further information apart from the threshold that triggers the report. In this case, we know that SMTP messages have been queued for more than five minutes, but we do not know how many messages are on the queue or why the problem exists. To take further action, we need to locate the server in its administrative group and examine its queues and then look at other information such as the application event log on the server to determine the root cause. ESM can reveal the queue information, but an ability to provide other pointers is lacking.
In addition, to display monitoring status, ESM must fetch data from multiple sources and this slows response. For example, it takes ESM nearly 90 seconds to retrieve and display information about HP's Exchange 2000/ 2003 organization (124 connectors and 234 servers listed). The number of connectors seems excessive, even for a company as large and distributed as HP, but routing group connectors usually have two entries, one for the routing group at each side of the partnership, so this inflates the number. In addition, large organizations tend to have multiple Internet connections and host gateways for different email systems, which drives the number up further. The sluggish responsiveness of ESM when faced with large numbers of servers and connectors is one reason why you should consider deploying specialized monitoring software if your organization spans more than 20 servers. In fact, even below this point, dedicated monitoring software delivers great value, because it can identify and report on outages faster than you can notice problems, unless you are connected to the affected server when the outage occurs.
To get a view of the connectors and servers in an organization, you can click on Status and take the "Export" option to have ESM export the information listed in the right-hand panel to a comma-separated value file. You can then load the file into Notepad or, better still, Excel, to examine and analyze the data, as shown in Figure 11.62.
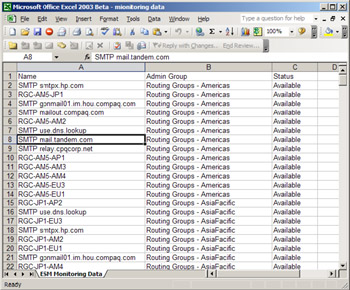
Figure 11.62: Examining monitoring data with Excel.
11.11.1 Monitoring and notifications
Exchange 5.5 uses server monitors to check periodically that everything is running as expected on a server. Exchange 2000 and 2003 use much the same idea, but notifications now implement the same basic principles as server monitors:
-
You establish a set of conditions that you wish to monitor on a server and assign a server to do the monitoring.
-
The System Attendant process monitors servers with RPCs, so you cannot monitor a server unless the network connection between the two servers supports RPCs.
-
If the System Attendant detects any problems on a server, it dispatches a notification via email or by executing a script that you define.
-
Email notifications can go to any valid email address, including pagers or via SMS to cell phones, or you can use a Windows script to call an executable or perform any other processing available to scripts. Because they can execute a wider range of actions, scripts are the more functional option, but most administrators opt for email notification because of the difficulty of automating a suitable response to the wide range of problems that can afflict servers.
As you can see in Figure 11.63, the HPQNET-DC9 server is monitoring itself, all the other servers in the organization, and all the connectors in the organization. Except in small or highly centralized organizations, where all the servers connect over a reliable high-speed network, it is not usually feasible for a single server to monitor every other server. It is more common to have one or two servers per administrative group monitor the other servers in the group. When you create a new notification, you decide which objects you want to monitor. ESM provides the following options:
-
This server (but if a server that monitors itself encounters a problem, it may not be able to report that a problem exists)
-
All servers
-
Any server in this routing group (that the connected server belongs to)
-
All connectors
-
Any connector in this routing group (that the connected server belongs to)
-
Custom list of servers (selected from the set of Exchange servers in the organization)
-
Custom list of connectors (selected from the set of connectors in the organization)
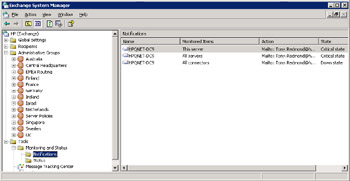
Figure 11.63: Server monitoring.
If a condition occurs on a monitored server, such as disk space going under a predefined threshold, the monitoring server detects the problem and executes the notification action. In the cases shown in Figure 11.63, we elect to send an email message.
You can click on a notification to see the instructions for the System Attendant when it detects a problem on a server that it monitors. Figure 11.64 shows the notification parameters and an example message. In this case, we determine that email should go to two addresses for pager devices. Because an Exchange outage may affect our ability to send messages outside the organization, we define a special email server for the System Attendant to send the messages through. It is quite common to use a special SMTP server, perhaps a relay server in the DMZ, for this purpose, because you never want to be in a situation where the messaging system is inoperative and you do not know about the problem.
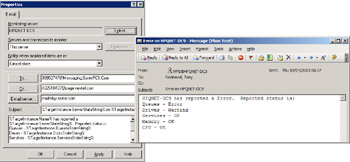
Figure 11.64: Notification parameters and a notification message.
You can edit the subject and the content of the notification message as long as you are careful not to change the predefined fields that Exchange fills with information about the problem. TargetInstance is used to reference the name of the server being monitored, and, as you can see in Figure 11.64, TargetInstance has a number of properties that are used for reporting, including QueuesStateString, which is used to insert the status of the message queues (both SMTP and X.400). The details of reported problems are limited, but certainly enough to alert system administrators that they need to take some action, if only to get some additional information about the problem.
You can define monitoring parameters for a server in two ways. First, you can select the server from its administrative group, and then set parameters through the "Monitoring" property page. Alternatively, you can click on Status and select a server from the list ESM displays, and then look at its properties. In either case, you will see something similar to the screen shown in Figure 11.65, which details a common set of monitoring parameters. The "Disable all monitoring of this server" checkbox allows or prevents server monitoring. By default, Exchange clears the checkbox, meaning that servers automatically publish monitoring data via WMI. You should not set this checkbox unless you have a good reason not to monitor a server. Table 11.9 lists the monitoring conditions that you can define.
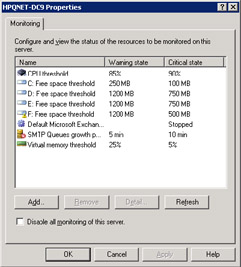
Figure 11.65: Defining conditions for monitoring.
| Condition | Notes |
|---|---|
| Free space threshold | Set warning and critical levels for available space on a selected volume. You can set different conditions for every volume connected to the server. Typically, you monitor free space on the C: drive, as well as those used for the Exchange databases and transaction logs. |
| CPU threshold | Set warning and critical levels for CPU use over a sustained period. It is best practice not to exceed 80 percent CPU use over five minutes on an Exchange server. |
| Available virtual memory | Set warning and critical thresholds for available virtual memory. Do not let virtual memory fall below 25 percent (free) on an Exchange server. |
| Windows service available | You can monitor the availability of any Windows service. For example, you could check to ensure that the IIS Admin service is running or that a service used by a third-party backup utility is available. |
| Exchange service available | Monitor that the standard set of Exchange services is available. You can add to this list of services if required. |
| SMTP queue growth | Set thresholds for continuous queue growth for the SMTP virtual server. Given the speed of the Routing Engine and SMTP transport, queues should not accumulate over a sustained period. If messages are on the queue for longer than five minutes, and you have a constant network link to other routing groups and servers, this is probable evidence of a problem with a connector. |
| X.400 queue growth | Similar to the SMTP queue growth, except that this pertains to MTA queues for connectors such as Lotus Notes or GroupWise. |
|
| < Day Day Up > |
|
EAN: 2147483647
Pages: 188