Monitoring Project Server and Windows SharePoint Services
| Reliability, performance, and security are vital to any organization. A proactive approach to managing your infrastructure requires real-time monitoring. This section outlines several recommendations for monitoring Project Server, WSS, and their components and is intended to complement your existing monitoring processes. As any system administrator knows, the first step in resolving any problem is becoming aware that a problem exists. Waiting for your user base to report an issue is a reactive approach and can result in unnecessary and redundant calls to your help desk. Windows 2003 Server Log File MonitoringThese days log management is an essential skill for any IT administrator or network security professional, and a Project Server administrator is no exception. It includes the monitoring, collection, consolidation, and analysis of log files and is a necessary and vital component to maintaining a healthy and secure system. With the vast amounts of log data being passed to a system, these activities can be a burden. Understanding where Project Server 2003 logs its information, warnings, and errors can help to reduce the effort and provide a valuable proactive troubleshooting tool. Real-Time MonitoringReal-time monitoring provides a proactive approach to diagnosing potential problems with Project Server 2003 and should be considered a cornerstone in any organization's network security plan. The presence of a strong event monitoring strategy provides a substantial advantage in identifying problems and potential threats early on instead of investigating them after the fact. Consider real-time monitoring to be a sort of "early warning" system. The Microsoft Windows 2003 Server family provides an extensive mechanism for event log monitoring. If you've administered Windows Servers before, you are no doubt familiar with the Event Log Viewer built in to the operating system. To find this valuable tool, select Start, Run; type in eventvwr; and click OK. The Event Viewer window is launched, as shown in Figure 25.1. Figure 25.1. Event Viewer filtered by Microsoft Project errors only.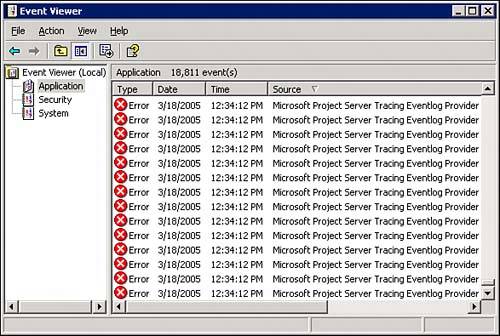 Project Server 2003 events are stored in the application log and have a source of Microsoft Project Server Tracing Eventlog Provider. If your Project Server hosts many other applications, you may want to create a custom filter and key off of this source. The application log is useful for tracking issues related to the access and publishing of projects and views in Project Server. If you start to notice high numbers of Error events, it is time to investigate further. Project Server error events almost always contain the following elements:
NOTE Not all Project Serverrelated errors contain Microsoft Project Server as the source. Pay close attention to errors related to any of the related components listed at the beginning of this chapter. The other important log to monitor for Project Server is the security log. This log contains the successful, and more importantly, the failed attempts to authenticate on the Project Server. Monitor this log carefully for potential illegal attempts to access your system. TIP Several third-party tools can monitor the event logs in Windows and alert you to potential problems real-time. Do a search online using the keywords "Event Log Management software" for suggestions and potential software solutions. Internet Information Services (IIS) Log File MonitoringDepending on your organization, you may have a web administrator who is already familiar with the IIS logging portion of this chapter. This section outlines some recommendations for monitoring and logging entries in IIS 6.0, as well as highlighting basic, normal Project Server type entries. The Importance of IIS LoggingKeeping good IIS logging information is important primarily because it will assist you in tracking down potential problems as well as provide a detailed record of transactions for security and monitoring purposes. IIS logs can contain a lot of useful information for recognizing unauthorized entries into the Project Server including IP addresses, information accessed, logon information, and so on. In addition to the security benefits, these logs contain error entries and time stamps that assist in identifying performance problems and other potential project server issues. Log File Formats and LocationsIIS provides the following formats for logging:
TIP Microsoft provides a tool called CONVLOG.EXE that can convert log files from one format to another. It is located in the \%WinDir%\System32 directory. Each website under IIS is assigned a logging folder based on the type of service. This folder name can be found by following these steps:
You should see the Log file name listed toward the bottom of the window. The actual logs are stored in \%WinDir%\System32\Logfiles\[folder name]. Recommended Logging OptionsFor the most part, the default logging options are sufficient. You should add one extra field labeled "Time Taken (time-taken)," because this field can shed some light on slow response times through PWA. Follow the same steps you used previously to find the log folder name to modify the logging properties. Table 25.1 lists recommended settings.
When troubleshooting, you may find other fields helpful, but be aware that writing longer log files decreases the overall response time of the server. Typical Project Server EntriesThe most common Project Server entries almost always look like the following:
For example:
In the preceding example, IIS returned a status code of 200, which translates to "OK. The client request has succeeded." For a list of other IIS status codes, try referencing Microsoft Knowledge Base article 318380. As with most content on the web, a search may be necessary if the preceding article is unavailable. Monitoring SQL Server 2000This section outlines recommendations for monitoring usage, performance, database connections, and log files associated with SQL Server 2000 as it relates to Project Server 2003. Establishing a BaselineAn important element to monitoring SQL Server is creating a baseline. Over time, performance will degrade, and without a solid baseline it is difficult to troubleshoot problems. Keep in mind four key areas when monitoring performance and creating baselines:
Project Server relies heavily on SQL Server performance, and most bottlenecks can be traced to one of the four key areas just mentioned. It is recommended that you use the built-in Windows performance monitoring (PERFMON.EXE) tool and the SmokeTest utility, freely available from Microsoft, to create your baseline. The SmokeTest utility tests the basic functionality of a Project Server 2003 installation, but it also has the capability to put a valid load on the system. The following list represents Microsoft's recommended counters for monitoring SQL using PERFMON.EXE:
NOTE A more detailed explanation on what each counter monitors and how to create a baseline chart can be found in the book Microsoft SQL Server 2000 Operations Guide published by the Microsoft Corporation, 2002. Tracing Events Using SQL ProfilerSQL Server 2000 includes a powerful tracing tool called SQL Profiler. The SQL Profiler can monitor the server and databases providing an effective method of tracking activities and events associated with a SQL instance. This can be especially useful when trying to troubleshoot performance issues with Project Server. For example, you can monitor the activities of connected users allowing the ability to track concurrent usage and memory overhead. Monitoring Connections to Project Server 2003Using SQL Profiler, you can monitor connections to the Project Server 2003 database. To do this, launch the SQL Profiler from the Tools menu in Enterprise Manager and perform the following steps:
You see a results window like the one shown in Figure 25.2. Users with open Project Professional sessions will show up with an EventClass of ExistingConnection with the login name of the Project role defined during the installation. Two application-level user logins are created by default during installation: MSProjectServerUser and MSProjectUser. MSProjectServerUser is used by Project Server's web application to log on to the database (these connections are defined as a pool, so you may see several over time). Project Professional (the desktop client) uses the other application-level login (MSProjectUser). You can count the unique processIDs associated with MSProjectUser login entries to get an idea of concurrent connections to the Project Server database. Figure 25.2. The results of this trace show one active connection (from Project Server) to the Project Server DB. NOTE The default usernames, MSProjectServerUser and MSProjectUser, can be modified during installation so that they may be different in your implementation. Check the security logins using Enterprise Manager to verify. NOTE Each active session of Project Professional shows up with multiple rows in Figure 25.2. Look at the ClientProcessID column to determine unique connections. Additionally, this type of trace only tells you the current connections when the trace was executed. It will not pick up any new connections that occur after the trace was started. Analysis Services MonitoringThis section outlines recommendations for monitoring Analysis Services as it relates to Project Server 2003. Enterprise and Standard Edition DifferencesJust like SQL Server 2000, Analysis Services (AS) comes in a Standard and an Enterprise edition. Project Server uses both versions the same with the exception of implementations that include an extranet (outside your firewall) component. AS Standard transmits OLAP cube requests over port 2725, which is typically closed on the firewall. This issue results in an error, like the one shown in Figure 25.3, for computers accessing Portfolio Analyzer views from outside the firewall. For more information on extranet implementations, see the Project Server 2003 Installation Guide and the Project Server 2003 Configuration Planning Guide published by Microsoft. Figure 25.3. This OLAP error can appear if permissions are applied incorrectly to the OLAP cube or if the wrong edition of AS is used.
The Enterprise edition allows for these transactions to use port 80 or port 443. Monitoring Log EntriesFrom the monitoring standpoint, Analysis Services can be monitored from the event logs in Windows 2003 Server. Entries show up under the application logs in the Windows Event Viewer (EVENTVWR.EXE). Typical implementations of Project Server schedule a nightly build of the OLAP cube. By monitoring the event logs, you can actively alert and troubleshoot potential failed builds. The following is a log entry example of a failed cube build:
|


EAN: 2147483647
Pages: 227