Triceratops Encounter at Universal Studios Florida Island of Adventure
| The movie Jurassic Park included an encounter with a sick triceratops lying on her side. In the theme park attraction, a veterinarian attends to a sick but standing "Sarah" who seems to acknowledge visitors to her paddock where she is being examined. The 24-foot triceratops looks, feels, acts, and even smells like a real animal, complete with actions such as breathing, blinking and pupil dilation, flinching, sneezing, drooling, and excreting. Visitors are never more than six feet away and can even pet her. Given these encounters, the team's overall goal was to make a creature more believable and lifelike than any before. The state of the art at that time was the "DinoAlive" exhibit at an Osaka Japan museum that relied on hydraulics to give the creature smooth, quick movements. Vickers Inc. of Troy, Michigan [Horgan, Gottschalk] designed the creature and set a very high benchmark for realism of motion and appearance. For example, the 40-foot-high Tyrannosaurus Rex could move from a resting position to fully erect in only 1.5 seconds. The Jurassic ride in Hollywood also reflected where the industry was in June of 1996. The animals were fairly realistic but not convincing, especially if you were able to stop the show and examine them closely. There was also a great concern with reliability. Thus, very stringent requirements were made so that close encounters such as petting would be thoroughly convincing. QFD TemplateAs a design method, QFD is no cookie-cutter approach. A project worth doing well deserves to have QFD tailored to the needs of the company, the team, the customers, and the customers' customers. The team used QFD in the conceptual stage to bridge the gap between the artist and the engineer so that the process was really tailored to suit the "skunk works" fast-turnaround working environment in which the program ran. The conceptual design Scope of Work document that the team used to drive the QFD study specified that the outcome should include such specifications as degrees of freedom of movement, maximum velocity, range of motion, skin characteristics, and so on. These were to correspond to various scenarios that the animators portrayed in some 60 storyboards which included such activities as sneezing, playing, and moving legs. Given the time and cost budgets, the MD Robotics team wanted to put its earliest efforts on the dinosaur's most important aspects. The scope of work, however, did not indicate that any one storyboard activity was more critical than anotherthey were all equally important. Also problematic was the fact that for a company that builds space and defense components, translating the requirement of "sneezing" into an animatronic design was not something their engineers had done before. After an initial QFD introduction, Mazur's task was to customize the QFD process to deliver these needs. Bolt led a review of the Scope of Work document, and three key elements emerged:
To clarify the customer's requirements, we began a Voice of Customer Analysis of the Scope of Work document. First we used the Voice of Customer Table 1 (Customer Context Table) to break down the details of the scope of work into singular statements and to then reword them with regard to the context of use. Then we used the Voice of Customer Table 2 (Customer Voice Table) to sort the statements, first as benefits versus features and then detailing the features into additional categories that became the axes of the subsequent matrices. Figure 25.2 shows a deployment flowchart. Figure 25.2. QF5 Flowchart for Triceratops Encounter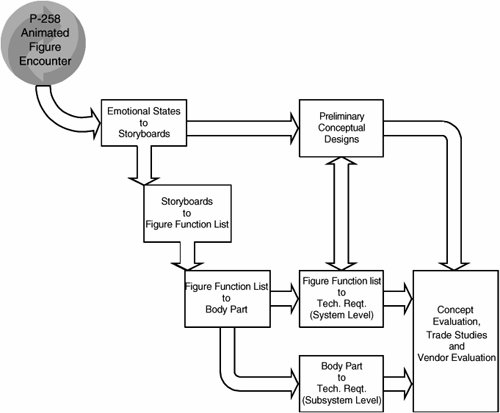 Voice of Customer AnalysisThe Voice of Customer Table 1 (VOCT1) is commonly used to clarify complex customer requirements, particularly in the context of use of the product or service. Context is easily described by the 5W1H (who is using it, what they are using it for, and when, why, and how they are using it). Table 25.1 shows an excerpt from the VOCT1 for end-product requirements.
The Voice of Customer Table states the requirement of "animal-like reactions to the guests," who are described as families with elementary school-age children visiting the Triceratops Encounter paddock after experiencing the park's thrill rides. The reworded data reduces the complex requirement into singular terms to address the contextual concerns. Simply put, this attraction must not be a let-down after the park's action rides, and it must keep the interest of children ranging from young enough to be amazed by seeing a "live" dinosaur to young teens amazed to see something so lifelike in terms of both appearance and behavior. The reworded data begins the process of analyzing the voice of customer data into the details in the table. The Voice of Customer Table 2 (VOCT2) sorts this reworded data on whether it describes a product feature or the customer benefit the feature must provide. Product features are broken down further into performance measurements, functions, reliability, safety, technologies, materials, components, and so on. In this case, for conceptual design, the categories were storyboards, body motions, technical requirements, and concepts (see Table 25.2).
These VOCT tables structured and analyzed both hidden and known requirements of the final product. The Voice of Customer Analysis in QFD also has the tools and methods to move up and down the customer value chain and can translate and link the requirements of end users (guests), the attraction operator, the maintenance crew, the installers, theme park management, and animators. One method for doing this is called going to the gemba or to the place where the product is used. Here we have features and benefits for the end product, but what about the benefits to the consumer? Since no consumer had ever seen a moving dinosaur, their interpretation of "realistic" was limited to their imagination based on illustrations, cartoons, or other robotics. It was relatively easy to see that you could visit the operator, maintenance, installer, management, and animator gembas at an existing amusement park, but what about the dinosaur gemba? As vendors to the space industry, MD Robotics engineers were adept at simulating environments. It is well known that you can use swimming pools and high-altitude drops to simulate the microgravity of space, and that aerospace vendors use them frequently during design. To simulate the Triceratops Encounter, the engineers visited a petting zoo in Toronto where they observed children encountering live animals. This helped them better understand the expectations and interactions children would be familiar with. They learned that the general public looks for anthropomorphic qualities in the animals; in other words, they attach human emotional states to the animals' actions. They also noted that with the dawn of the information age, people and, specifically, children are incredibly knowledgeable when it comes to dinosaurs. For an animal to be convincing, its stance, motion, and look must be correct with the state of knowledge within the paleontology world today. From this gemba, the engineers structured the emotional states they detected with an Affinity Diagram and a Hierarchy Diagram (see Table 25.3). They presented these emotional states to the animators for prioritization based on how each emotional state contributed to making the attraction popular and enjoyable. An interesting dichotomy arose because the animators placed a higher priority on a natural-looking effect which tended to emphasize gross body motion associated with distant viewing, while guests at the zoo wanted more contact with the head which tended to emphasize detailed head sub-mechanisms such as tongue, nostrils, and so on. Mazur recommended using sales points in the "House of Quality" to reemphasize those emotional states that were oriented more toward visitor contact.
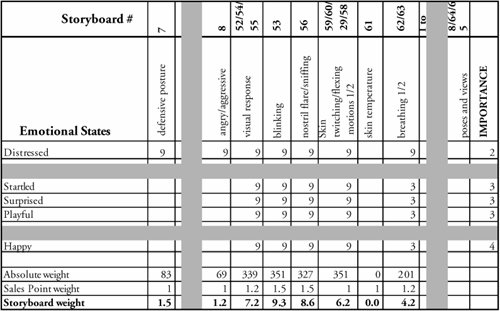
The main means the animators used to convey the creative requirements to the MD Robotics team was storyboards. Figure 25.3 shows an example. Figure 25.3. Example of a Storyboard© Storyboards by Hall Train (August 1996). Emotion DeploymentThe engineers then used the emotional states that both the Hall Train animators and the petting zoo guests prioritized to prioritize their 65 storyboards in order to determine which postures and positions most strongly correlated with the most important emotional states. Using this process they formed the emotional state versus storyboard matrix. This enabled the design team to get a feeling for how important each storyboard was to the show. Table 25.4 shows this deployment matrix.
In this matrix, the emotional states are weighted on a 1 to 5 scale, with 5 being the most important. The degree of correlation between each body motion and emotional state is indicated in the intersecting cells of the matrix, using the values of 1 for some correlation, 3 for average correlation, and 9 for strong correlation. The emotional state weight is then multiplied by the correlation value in each cell, and the results are summed column by column (absolute weight). This tells which body motion has the most and the strongest overall contribution to the most important emotional states. As mentioned earlier, there was a dichotomy between the animators and the petting zoo visitors we observed, and so we factored in a "sales point" to add more importance to head contact storyboards. In QFD, sales points further emphasize exciting requirements multipliers (1 is "not exciting," 1.2 is "exciting," and 1.5 is "very exciting"). Then we multiplied the absolute weights by the sales points, and normalized to a percentage to yield the storyboard weights. The storyboards with high weights are critical to conveying an exciting show to visitors. For example, the triceratops flaring its nostrils is crucial to conveying whether it is happy or startled (see Figure 25.4). Figure 25.4. Storyboard 56. Nostril Flare.© Storyboards by Hall Train (August 1996).  Body DeploymentNext, we used the QFD process to take this down another level to get the relationship between the storyboards and body motion, and then from the body motion to detailed body parts. Our main benefit in doing this was to see the relevance of the body parts to the emotional states. Because the emotional states were now weighted, this assured us that we would spend our time on the dinosaur's most relevant physical components. We structured body motions with an Affinity Diagram and a Hierarchy Diagram (see Table 25.5) and then we joined them in a matrix with the weighted storyboards.
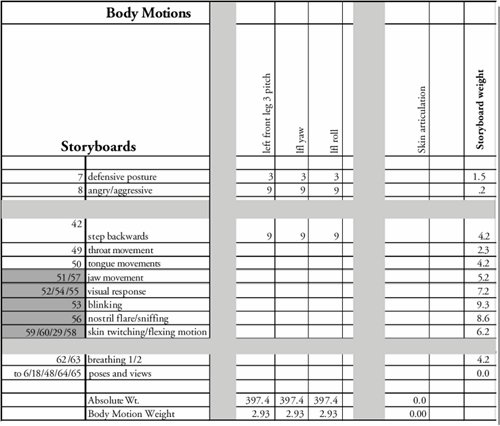
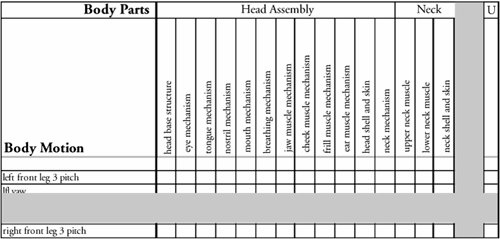
The Storyboard versus Body Motions Matrix (see Table 25.6) shows the correlation of each body motion to displaying the theme of the storyboard and then weights the body motions using the same process as in Table 25.4. The first row, for example, shows that "left front leg 3 pitch" plays an average role in a defensive posture. In Table 25.6, the body motions have been rearranged in descending order of importance.
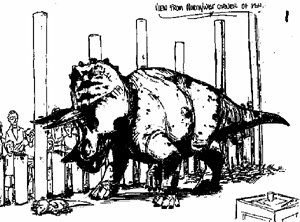
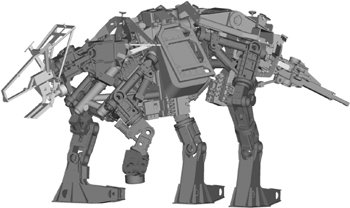
At this point, we deployed body motions into specific body parts indicated in the primary structure of the triceratops shown in Figure 25.5. A Body Motion to Body Parts Matrix translated the body motion weights into body part weights (see Table 25.7). This would tell us, among other things, how big a role the head base structure would play in the body motion function of head movement. Figure 25.5. Primary Structure of Triceratops
Engineering Requirements DeploymentOur next step was to develop engineering requirements that would lead to design specifications and structure them in a Hierarchy Diagram (see Table 25.8).
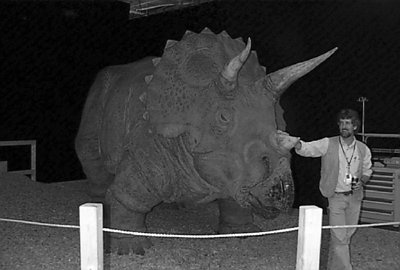
We deployed both the weighted body motions and the weighted body parts in matrices to determine which engineering requirements required the most exacting specifications. These matrices are not shown in this chapter. Additionally, we created matrices to identify and design out potential failure modes. Later in the study, these charts helped simplify certain systems and components resulting in lower cost, faster design, and improved reliability. The May 1999 opening of the new Triceratops Encounter at Universal Studios' Jurassic Park attraction prompted U.S. News & World Report to write "these three creatures snort, stomp their feeteven pee. Ask the 'keeper' if you can pet them. It's up to him or her to decide."[2] (See Figure 25.6.) Figure 25.6. The Prototype of "Sarah" Being Reviewed by the Customer |
EAN: 2147483647
Pages: 394