| An interrelationship diagraph (I.D.) helps you explore and identify causal relationships between various ideas. Thus, it is an extension of an affinity diagram and is often drawn after an affinity diagram has been constructed. In the original JUSE list of new tools, it was called a relations diagram.[2], [3] I.D. is used to further clarify complex and intertwined cause-and-effect or means and goals relationships among various groups of ideas identified in an affinity diagram, cause-and-effect diagram, tree diagram, or ideas developed by brainstorming. In contrast to an affinity diagram, which displays natural or logical groupings, I.D. shows logical relationships between ideas. It also reveals patterns and sequencing of ideas. The relationships are shown by one-way arrows and can be further clarified with words and phrases in rectangles or ovals. They often get too complicated and may be of little use if poorly constructed. Usability of the diagraph depends on involvement of key personnel who can identify relationships between ideas correctly. It may be helpful to use cause-and-effect diagrams and tree diagrams, discussed next, in addition to affinity diagrams, as sources of data. In a design context, I.D. helps identify key design elements to meet a particular set of user requirements. An I.D. has various formats, but we will discuss just the centrally converging type.[7] Here the goal/problem being discussed is written on a sticky note and placed on a flip chart. It should be a different color than the other notes. Similarly, in a completed diagraph, the goal/problem should be stated in a larger, shaded rectangle. The arrow is one-sided and points from cause/means to effect/goal. The following are the typical steps in creating an I.D.: 1. | Form a team of five to nine people to brainstorm about the problem. Persons selected should have worked successfully as a team in the past and should have intimate, firsthand knowledge of the problem or opportunity to be discussed.
| 2. | Describe the problem to be solved: "What key issues are related to reducing software complexity?" Write it on a sticky note, and place it on the display board. This may be done as part of a preparatory meeting where members are also briefed about the approach. It is important that members have undergone training on the 7 MP tools.
| | | 3. | Generate ideas by brainstorming, use a tree diagram (discussed next), or use the ones created as idea notes in an affinity diagram, which is the most common source of ideas used to create an I.D. If affinity diagram notes are used, all the note items except the headers can be used. If the problem to be solved relates to a particular header, additional ideas may have to be generated, because the notes related to all the other headers would be discarded. There should be between 9 and 50 idea items for the problem to be addressed by I.D. Otherwise, the problem is either too simple or too complex to be addressed by this method.[8] Brassard suggests that the number of ideas to be pursued be kept between 5 and 25 to keep them manageable.
| 4. | Place all the idea notes randomly on a flip chart. Remember to remove the header cards and mix up the rest of the idea notes thoroughly before placing them on the flip chart. Random placement forces you to think in multiple directions, because there is no choice.[9] When the notes are all on display, the team agrees on which of the items have cause/means-effect/goal relationships and connects all these by one-way arrows. It is best to go card by card to determine cause/effect relationships with all the other cards: "What idea(s) have a major influence on the outcome of this particular item?" Two-way questions and two-way arrows should be avoided. Instead, just repeat a "cause-out" (cause-effect) question for each card, and decide on the major influencer item in each case.[10] Unlike an affinity diagram, some discussion will be needed to reach a consensus, but too much discussion may be dysfunctional. Too much discussion isn't really warranted, because there will be an opportunity for revisions in subsequent meetings. Revisions are essential when dealing with any complex issue.
| 5. | Copy the I.D., and distribute it to members. Several important tasks, such as further investigation and review based on realistic data, are carried out between meetings. The whole exercise should be fast-paced. Therefore, the next meeting should be convened fairly soonwithin a week or so if practical.
| | | 6. | Revise the I.D. in subsequent meetings as new facts emerge and further interactions are identified. Discuss, agree on, and choose the follow-up projects from the key items and factors identified in the I.D. Count the number of outgoing and incoming arrows for each idea. The item with the most inward arrows (the outcome) is the most crucial issue. The item with the most outward arrows (the driver) has the most influencing factors. It is shown with a bold and broken border in Figure 7.3. Similarly, the next few levels of note items should be identified. The ones with the largest number of outgoing arrows represent some key issues that must be addressed to correct a large number of problems or desired outcomes. Similarly, the largest number of incoming arrows represents secondary issues involving important problems or bottlenecks that must be addressed. It is important to continue to work on consensus in identifying the items to be addressed; it should not be on the basis of number of arrows alone. In the interest of manageability, choose a maximum of five to seven items (projects) to pursue further.[11] It is possible to have more than one key and one secondary issue. These issues are often examined using a tree diagram, as discussed next.
Figure 7.3. An Interrelationship Diagraph 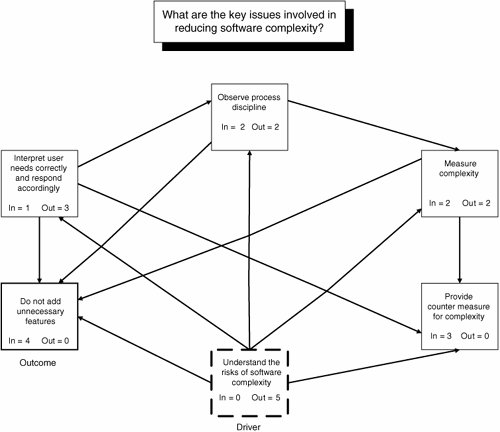
|
|