Affinity Diagram
| An affinity diagram is a set of ideas about the topic in question that are grouped based on their similarity. It is a problem-solving tool for chaotic, difficult, and complex problems. This method helps you better understand the problem from a number of diverse, piecemeal, and fragmented verbal data. It can be especially useful in requirements development and design stages of a software development process. Creating an affinity diagram basically has three stages:
Generating valid worded data, spoken as well as written, in people's own words, is crucial. Several sources should be used for this purposethe more sources, the better. Formal and informal meetings, correspondence, interviews, responses to survey questionnaires, and complaints from customers can all be valuable sources of customer data. In a software development process, end users are not the only sources. Valuable data can also be obtained from the management in the customer organization, software developers, outsourcing partners, and the management team in software development organization. Regulatory requirements should also be used as sources of data. But the focus of any requirements development and design data should be the customers and users. Even in new product development, the voice of potential customers is a required input. After the written data have been obtained, further data can be generated by a brainstorming process involving a group that has some prior experience with working together effectively. Ideally, they should also possess knowledge to deal with the issues to be discussed. The brainstorming format is similar to the one we discussed in cause-and-effect diagrams, described in Chapter 6. Four basic rules should be observed:[6]
The pace of brainstorming should be swift and answers and statements should be short to maintain the tempo. This way, you can generate a lot of data without getting bogged down in a particular issue at this stage. It is not uncommon to come up with dozens of ideas within an hour. The following are typical steps in constructing an affinity diagram:
An affinity diagram is the end product of the collection of these groups and subgroups with appropriate headings. It may be ready for the next step in the planning process or used for further discussion and refinement. The affinity diagram is among the most widely used 7 MP tools. It is basically a team-based creative exercise that uses logical groupings to identify and group major issues related to a problem. These groupings, after they are correctly identified, can lead to innovative solutions. The affinity diagram can be used either as a stand-alone tool or preferably as part of a problem-solving process using other 7 MP tools as needed. Figure 7.2 depicts a typical affinity diagram. Figure 7.2. An Affinity Diagram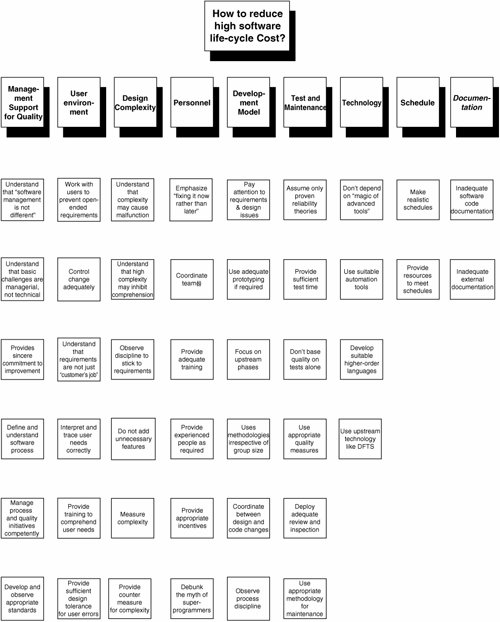 |
EAN: 2147483647
Pages: 394