Inserting and Formatting an Organization Chart
Microsoft Office Specialist You can use PowerPoint s diagramming tool to create a variety of diagrams, including organization charts, or org charts . An org chart shows the relationships among the elements of an organization ”for example, the relationship between a manager and her subordinates or between a parent company and its subsidiaries.
You create an org chart by double-clicking an org chart placeholder or by clicking the Insert Diagram or Organization Chart button on the Drawing toolbar. A sample org chart appears with boxes in which you can enter names . To add a new box to the chart, you select the adjacent box, click the down arrow to the right of the Insert Shape button on the Organization Chart toolbar, and do the following:
-
Click Coworker to place the box next to the selected box and connect it to the boxes on the same level.
-
Click Subordinate to place the new box below the selected box and connect it to other boxes below the selected box.
-
Click Assistant to place the new box below the selected box and connect it only to the selected box.
After creating the org chart, you can double-click it to edit it at any time. If you add a chart box in the wrong place, you can select it and then press the [DEL] key to remove it. You can also rearrange boxes by dragging them.
By default, the org chart appears in a traditional hierarchy, with one manager at the top and subordinates below. You can use the AutoFormat button on the Organization Chart toolbar to change the chart style. You can also format the chart boxes and their connecting lines individually. You can change the chart box color, shadow, border style, border color , or border line style by clicking buttons on the Drawing toolbar.
| Tip | You can take advantage of the enhanced functionality of PowerPoint 2003 s diagramming tool by converting org charts created with previous versions. After opening the presentation in PowerPoint 2003, double-click the org chart to convert it. |
In this exercise, you will add an org chart to a slide, enter text, add a chart box, and then change the chart style.
USE the InsertOrg presentation in the practice file folder for this topic. This practice file is located in the My Documents\Microsoft Press\PowerPoint 2003 SBS\AddingTable\InsertingOrg folder and can also be accessed by clicking Start/All Programs/Microsoft Press/PowerPoint 2003 Step by Step .
OPEN the InsertOrg presentation.
-
Move to Slide 12, and double-click the org chart placeholder.
The Diagram Gallery dialog box appears with the Organization Chart option selected.

-
Click OK .
A default org chart object is inserted into the slide, with the top chart box selected. The Organization Chart toolbar is also displayed.
-
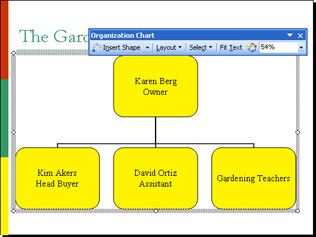
Click the top box, type Karen Berg , press [Enter], and type Owner .
-
Click the lower-left chart box, type Kim Akers , press [Enter], and type Head Buyer .
-
Click the lower-middle chart box, type David Ortiz , press [Enter], and type Assistant .
-
Click the lower-right chart box, type Gardening Teachers , and then click away from the chart boxes but within the org chart object.
-
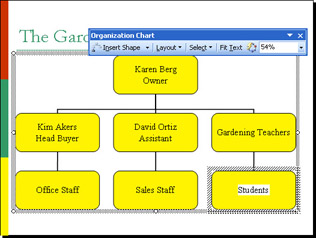
Click the lower-left chart box (don t click the text). Then on the Organization Chart toolbar, click the down arrow to the right of the Insert Shape button, and click Subordinate on the drop-down menu.
A subordinate chart box is placed below the selected chart box.
-
Click the subordinate chart box, and type Office Staff .
-
Click the lower-middle chart box. Then on the Organization Chart toolbar, click the down arrow to the right of the Insert Shape button, and click Subordinate .
-
Click the subordinate chart box, and type Sales Staff .
-
Add a subordinate box to the lower-right chart box, click it, and type Students .
-
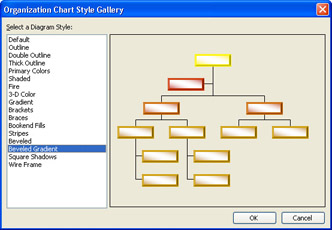
On the Organization Chart toolbar, click the Autoformat button.
The Organization Chart Style Gallery dialog box appears.
-
In the Select a Diagram Style list, click Beveled Gradient .
-
Click OK .
The style of the organization chart changes.
-
Click the Kim Akers chart box. Then on the Organization Chart toolbar, click the down arrow to the right of the Select button, and click Level on the drop-down menu.
All chart boxes at Kim Akers level are selected.
-
Hold down [SHIFT], click the Karen Berg chart box, and then click the Bold button on the Formatting toolbar.
The first two chart levels are now bold.
-
Click outside the org chart object to deselect it.

-
On the Standard toolbar, click the Save button to save the presentation.
CLOSE the InsertOrg presentation, and if you are not continuing on to the next chapter, quit PowerPoint.
| |
In addition to org charts, you can create a variety of built-in diagrams, including cycle, radial, pyramid, Venn, and target diagrams. You can create and format these other types of diagrams by using techniques similar to those you use with org charts.
To insert and format a diagram:
-
Double-click a diagram placeholder, or on the Drawing toolbar, click the Insert Diagram or Organization Chart button.
-
The Diagram Gallery dialog box appears.
-
Click the diagram option you want, and click OK .
-
A sample diagram appears on the active slide with text shapes and labels appropriate to the type you chose.
-
Type information in the boxes and replace labels with your own text, as necessary.
-
If you want, use the AutoFormat button on the Diagram toolbar to change the format of the diagram.
| |
EAN: N/A
Pages: 145