Inserting and Formatting a Chart
Microsoft Office Specialist For those occasions when you want to display numeric data visually, you can use Microsoft Graph, a program that works with PowerPoint to insert a chart into a presentation slide. After you create a chart, it becomes an embedded object on the slide.
You can start Graph in the following ways:
-
By double-clicking a chart placeholder on a slide
-
By clicking the Insert Chart button on the Standard toolbar
-
By clicking Chart on the Insert menu
In Graph, data is displayed in a datasheet and represented in the chart, as follows :
-
The datasheet is composed of rows and columns of cells that contain values, or data points , that make up a data series . Down the left side and across the top of the datasheet are gray control boxes that enable you to work with rows or columns of data. The first row and column of the datasheet hold the names of the data series.
-
The chart is made up of different elements that help display the data from the datasheet. A data marker is a graphical representation in the chart of each data point in a data series. The data is plotted against an x-axis ” also called the category axis ”and a y-axis ” also called the value axis. (Three-dimensional charts also have a z-axis.) Along each axis are labels, called tick-mark labels , that identify the data. A legend provides a key for identifying the data series.
In a datasheet, each cell is identified by its column letter and row number, as in A1. To perform most tasks on the datasheet, you must first select a cell or a block of cells, called a range . When a cell is selected, it becomes the active cell and is distinguished by a heavy border. When a range is selected, the active cell is white with a heavy border, and all the other cells in the range are highlighted in black.
| Tip | To select a single cell, simply click it. To select a range, click the first cell, hold down the [SHIFT] key, and then click the last cell. To select a row or column, click its control box. To select the entire datasheet, click the control box in the upper-left corner. |
To enter data into the datasheet, you can do one or more of the following:
-
Type the data into the datasheet
-
Import information from another program, such as Excel
-
Copy and paste a specified range of data or a complete worksheet into the datasheet
After the data is entered into the datasheet, you can easily modify and format the associated chart. Graph comes with 14 types of charts, each with two-dimensional and three-dimensional variations. Having selected a chart type, you can format the chart to get the results that you want.
In this exercise, you will create a Graph chart by importing and entering data, and then you ll format the chart.
USE the InsertChart presentation and Sales worksheet in the practice file folder for this topic. These practice files are located in the My Documents\Microsoft Press\PowerPoint 2003 SBS\AddingTable \InsertingChart folder and can also be accessed by clicking Start/All Programs/Microsoft Press /PowerPoint 2003 Step by Step .
OPEN the InsertChart presentation.
-
Move to Slide 11, and double-click the chart placeholder.
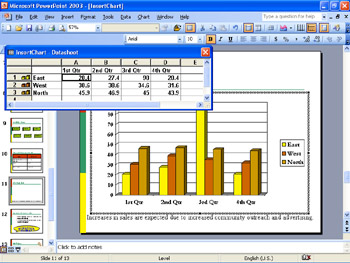
Slide 11 has already been formatted with the Chart AutoLayout. When you double- click the chart placeholder, PowerPoint starts Microsoft Graph. The Graph menus and Standard and Formatting toolbars replace PowerPoint s, and the datasheet and chart appear with default data that you can replace with your own data.
Tip If the datasheet obstructs the chart, you can move the datasheet window out of the way by dragging its title bar or by clicking its Close button. If the data- sheet is closed, you can click the View Datasheet button on Graph s Standard toolbar to open it.
-
If the toolbars appear on one row, on the Standard toolbar, click the Toolbar Options button, and then click Show Buttons on Two Rows .
-
In the datasheet, click the blank cell above East and to the left of 1st Quarter .
This is the cell Graph will use as the starting point for importing data into the datasheet.
-
On Graph s Standard toolbar, click the Import File button.
The Import File dialog box appears. This dialog box functions just like the Open dialog box.
-
If the contents of the My Documents folder are not displayed, click the My Documents icon on the Places bar, and then navigate to the Microsoft Press \PowerPoint 2003 SBS\AddingTable\InsertingChart folder.
-
In the list box, click Sales , and then click Open .
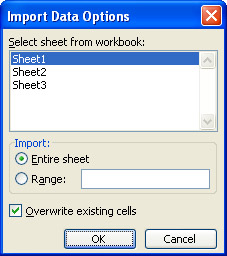
The Import Data Options dialog box appears. Sheet1 from the Excel workbook is selected as the one to be imported into the Graph chart.
-
Click OK to overwrite the current data in the datasheet.
Tip To change the size of the datasheet so that you can see all its data, drag the lower-right corner of the datasheet window.
-
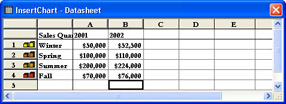
Click cell A4 , type $70,000 , and press [TAB].
Graph accepts the new entry, and B4 becomes the active cell.
-
In cell B4 , type $76,000 , and press [Enter].
Graph accepts the new entry and moves the selection down to cell B5.
Tip By default, Graph plots the series based on the rows in the datasheet. These series are identified in the legend. If you want to base the series on the columns instead, click the By Column button on Graph s Standard toolbar.
-
Close the datasheet window, and then on Graph s Standard toolbar, click the down arrow to the right of the Chart Type button, and then in the second column of the second row of the drop-down palette, click the 3-D Bar Chart .
The chart changes to a three-dimensional bar chart.
Tip You can give your chart a dynamic look by changing the 3-D view. With Graph, you can control the elevation, rotation, position, and perspective for a 3-D chart by using the 3-D View command on the Chart menu.
-
On the Chart menu, click Chart Type .
The Chart Type dialog box appears with standard and custom chart types and formats.
-
Click the Custom Types tab, and in the Chart type list, click Columns with Depth . Then click OK .
The chart changes to the Columns with Depth chart type.
-
On Graph s Standard toolbar, make sure the Chart Area appears in the Chart Objects box, so that the entire chart is selected.
-
On Graph s Formatting toolbar, click the down arrow to the right of the Font Size button, and click 18 .
The font size used for the x-axis and y-axis data labels and the legend changes to 18 points.
-
On the Chart menu, click Chart Options , and then click the Gridlines tab.
The Chart Options dialog box appears with the Gridlines settings.
-
In the Value (Z) axis area, select the Major gridlines check box, and then click OK .
Gridlines appear on the chart.
-
In the chart, click the horizontal x-axis ”the category axis ”where the year values are plotted.
Black handles appear at the ends of the axis.
Tip You can double-click almost any chart object to edit its attributes. For example, you can double-click the y-axis to display the Format Axis dialog box, where you can apply patterns and change the font, style, number format, and alignment.
-
On Graph s Formatting toolbar, click the Angle Counterclockwise button.
The x-axis text angle changes to a 45-degree angle.
-
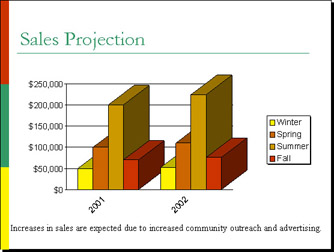
Click a blank area of the slide to deselect the chart object and quit Graph.
PowerPoint s menus and toolbars are restored, and the chart is embedded in the slide.
-
On the Standard toolbar, click the Save button to save the presentation.
CLOSE the InsertChart presentation.
| |
Microsoft Office Specialist If you have already created a chart in Excel, you can import it into a slide instead of having to recreate it in PowerPoint.
To insert an Excel chart object into a slide:
-
On the Insert menu, click Object .
-
The Insert Object dialog box appears.
-
Select the Create from file option, and then click Browse .
-
Navigate to the folder where the Excel workbook containing the chart is stored, click OK to close the Browse dialog box, and then click OK to close the Insert Object dialog box.
-
PowerPoint embeds the chart in the slide.
| |
EAN: N/A
Pages: 145