Navigating IEV to View Alarm Details
| [ LiB ] |
To display a view, click on the view name in the Views folder on the lower-left window pane, as shown in Figure 13.1. To close the view, right-click on the Views tab and select Close from the context-sensitive menu. Note that closing the view doesn't delete it from the database; to delete the view, right-click the view from the Views folder and select Delete View from the menu.
If you want to change the data source for the viewfor example, if you want to switch from the realtime events table to a previously imported fileright-click the view from the Views folder and choose Data Source from the drop-down menu to display the Change Data Source window. Choose the name of the database table of interest and click OK.
To delete an event from the database, right-click the event in the main view pane and choose Delete Row in Database from the menu.
Expanding Whole Details
If you want to display all the details of an IDS event, right-click the event and select Expand Whole Details from the drop-down menu to display the Expanded Details dialog window. Here you can choose to view the alarm detail according to Class A, B, or C Level addressing or for the whole address. Simply select the View tab which corresponds to the level of detail that you want to see.
Viewing Alarm Information
From the Expanded Details window, you can right-click on an alarm and select View Alarms to see the signature name and source and destination addresses for the corresponding alarm event. You can also see all the information associated with an alarm event by right-clicking on the event and selecting Show All Columns from the drop-down menu.
You can view alarm context data for Transmission Control Protocol (TCP)based signatures, for which the sensor can capture up to 256 characters of the TCP stream. The data in this stream is called the context data buffer and can contain keystrokes, data, or both in the connection stream around the string of characters that triggered the signature. In this way, it can be used to determine whether the signature triggered accidentally or from a deliberate attack.
To view the context data buffer, right-click the alarm you're interested in and choose Show Context from the drop-down menu to display the Decode Alarm Context with the signature and context information.
Creating Views
When an event is reported , it's easy to imagine a situation where you want to customize the data that is displayed, depending on the signature characteristics. Creating views is an easy way to do so. Select New, View from the File menu and follow the instructions of the two-step wizard, as shown in Figures 13.2 and 13.3.
- In the first page of the wizard, type the name of your view in the View Name text box. If you want to use a filter (covered later in this chapter, in the section "IEV Filters"), select the Use Filter check box and choose your filter from the Use Filter drop-down menu.
- In the Select the Grouping Style on Alarm Aggregation Table area, select the radio button that corresponds to the way you want to have the view group the signatures.
- In the Select the Columns Initially Shown on Alarm Aggregation Table area, choose the columns that you want to display on the alarm aggregation table by selecting the check box for each of the columns you want to view.
- Choose a column for a secondary sort order from the drop-down menu and click Next to continue to the second page of the View wizard, shown in Figure 13.3.
- On the second page of the View Wizard, choose the event_realtime_table from the Choose a Data Source drop-down menu.
- In the Select the Columns Initially Shown on Alarm Detail Table area, select the columns that you want to see in your alarm detail table. Then use the up and down arrow buttons to change the order in which you want them to appear.
When you are finished adding columns and determining the sequence, click Finished to create your view. Your new view appears in the Views folder on the lower-left pane of the IEV interface.
Figure 13.2. The first page of the View Wizard in IEV.
Figure 13.3. The second page of the View Wizard in IEV.
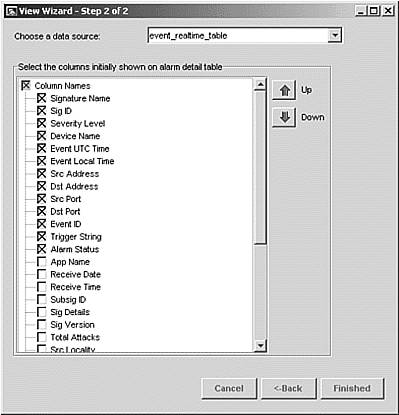
| | The up and down arrows in the Step 2 of 2 screen of the View Wizard allow you to adjust the order of the columns in the view. |
Realtime and Statistic Graph Data
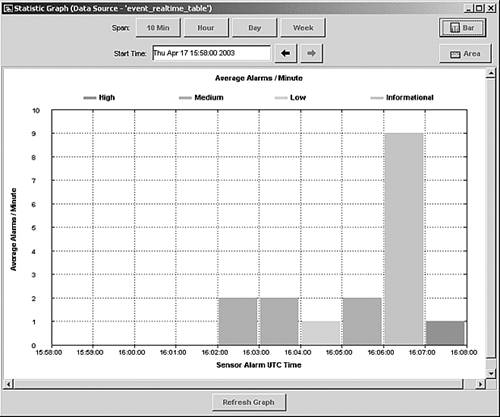
You can view both realtime and statistical data in a graph format, using either a bar or area graph format. Both graphs show the average number of aggregate alarms by severity level on the Y axis, per unit time on the X axis.
The Realtime Graph displays the average number of alarms received by IEV. The timestamp on alarms reflects the time that IEV received the alarm, rather than the time the sensor generated the alarm. To view the Realtime Graph, select Realtime Graph from the Tools menu.
The Statistic Graph is based on a data source that you select, which could be the event_realtime_table or any imported or archived table. The events displayed in the Statistic Graph reflect the average number of alarms received by IEV, based on the filter that is applied to the data source. Therefore, depending on the filter, the Statistic Graph might not reflect the true average number of alarms. The timestamps for these events in the Statistic Graph reflect the time that the sensor generated the alarm and not the time that the alarm was received by IEV (as is the case in the Realtime Graph).
To view the Statistic Graph, select the view from the Views folder in the lower-left pane which contains the alarm data that you want to display. Right-click the view from the Views folder and choose Statistic Graph. Figure 13.4 shows a sample Statistic Graph in bar format.
Figure 13.4. A Statistic Graph in bar format in IEV.
Realtime Dashboard
If you want to view a continuous stream of events from the sensor, you can use the Realtime Dashboard , as shown in Figure 13.5.
Figure 13.5. The Realtime Dashboard in IEV shows a continuous stream of events from the sensor.
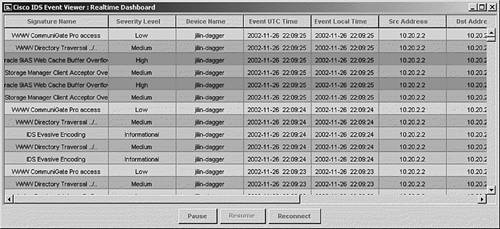
Select Realtime Dashboard, Launch Dashboard from the Tools menu to launch the Realtime Dashboard. IEV opens a subscription request to the sensor to display the most recent events received by the sensor since the request was issued.
To pause the continuous streamfor example, if you want to study one particular entryclick the Pause button on the bottom left; to resume the stream, click the Resume button. Because they are toggle buttons, only one option is available at a time.
To clear all existing events from the Dashboard and open a new subscription request to the sensor, click Reconnect.
| | The Realtime Dashboard displays the four security level events: Informational, Low, Medium, and High. |
| [ LiB ] |