Section 32. Overall Equipment Effectiveness (OEE)
32. Overall Equipment Effectiveness (OEE)OverviewOverall Equipment Effectiveness (OEE) is used extensively in the maintenance and equipment reliability world to examine equipment availability. Here the tool is similar but is applied differently. If you have a maintenance background and are familiar with OEE, do not skip this overview; there are some key differences to consider. Lean Sigma uses extensively the notion of entitlement, which is in effect perfection for the process. For example, a yield entitlement is 100% and for defect rates entitlement is zero. Capacity is a slightly trickier metric to apply entitlement to, but OEE helps us towards this goal. OEE represents the percentage of capacity entitlement that the process is currently attaining or in other words: OEE is broken into three elements, and in simple terms, a process achieves 100% OEE when it is up (running) doing only VA work 100% of the time, it is going as fast as it has ever gone, and it is producing 100% perfect quality entities:
The major difference from the maintenance version of OEE is regarding the %Uptime. In maintenance terms, %Uptime is the percentage of time that the process is available to do any work, even NVA work. In Lean Sigma, %Uptime is only the percentage of time that the process is doing VA work, which typically is significantly less. LogisticsAlthough OEE is an analysis tool and in theory could just be done by the Belt, in practice it takes the Team to gather the data and to correctly structure the results. Data is typically captured for a minimum of 24 weeks to be meaningful. The time period depends on the drumbeat of the process and the frequency of things, such as changeovers and maintenance time. For some large equipment processes, data for a whole year might be more relevant. The data is captured in three separate data captures running concurrently, one for %Uptime, one for %Pace, and one for %Quality. More often than not, the %Pace and %Quality can be calculated from historical data, so investigate them first. %Uptime is hardly ever measured in the way described previously; thus, a new (often manual) data capture is invoked. The operators themselves have to participate in the data capture, so planning and communication are key. A clear operational definition of the metric is required to explain what is being captured. Remember the data captured is just a sample and is used to look for opportunity, not measure the OEE to 3 decimal places. After the initial analysis is complete, OEE should be captured on an ongoing basis, along with other operations metrics to understand the level of capacity performance. % UptimeThis is purposefully not written in the form of "downtime" which can be misleading. The tendency is only to think of downtime as when the process is broken. In reality, the process is "down" at many other times Uptime is defined only as the time that the process (or process step) is up doing VA work. All other activities are all considered downtown, such as
Again, the metric is used to look for opportunity, not as a typical operations metric to judge supervisor performance for example. This simple distinction can bring a whole new perspective to a process. Processes that were previously seen as nearing 100% utilization are often less than 50% utilized. Uptime data is best captured by the operator over a period of two weeks or so, putting the activity time into predetermined buckets representing the possible activity classifications. This is usually a manual data capture with the operator writing times and activities on a table throughout the day. If the purpose is clearly explained to the operators, they typically don't try to "massage" the data because it's in their interest not to do so. For that reason, usually little Hawthorne Effect is seen. After the data is captured, it is usually analyzed in a simple Pareto Chart or Pie Chart as shown in Figure 7.32.1. Figure 7.32.1. An example of downtime classification.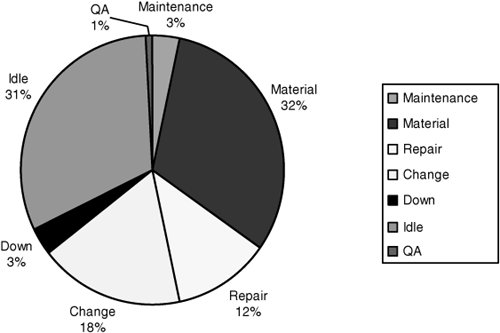 VariantsMost processes don't work 24 hours a day, 7 days a week. This often represents the simplest capacity expansion option, because no new capital is required and operating cost per unit is reduced because there are no additional warm-ups and cool-downs required. From the point of view of the OEE metric, this falls into the %Uptime element and is usually dealt with by introducing additional metrics:
Obviously many variants are possible depending on the business problem in hand. % PaceThis is usually the trickiest of the three OEE sub-metrics to measure and Belts often confuse it with %Uptime and %Quality. The simplest way to think of this is that sometimes processes slow down; they aren't fully "down," in that entities are still flowing through the process. The flow rate is reduced for some reason, maybe due to resource or material constraints, or to ensure that good product is being made (hence the confusion with %Quality). To calculate %Pace, it is necessary to determine the Peak Rate of the process in entities per unit time. This is done based on a very short duration (usually 14 hours of processing). After the instantaneous Peak Rate is found it is labeled as "entitlement" for as long as it is not surpassed. Then it becomes a matter of determining the typical processing rate. This is calculated by determining the average number of entities processed during the actual working time of the process (i.e., only during the uptime) usually over the period of a week or two. VariantsAnother, entirely equivalent, method of determining the %Pace is to judge the process by the time it takes to process a single entity. Another entitlement measure is introduced for the processing time, known as the Ideal Cycle Time, which is the time between entities exiting the process if there were literally no constraints, such as resource, and so on. This is equivalent to the instantaneous Peak Rate expressed in time (the faster the rate, the shorter the time). After the Ideal Cycle Time is known, it is simply a case of determining the average Cycle Time (based again on capturing data only during the uptime of the process) and working out the ratio of the two numbers: or simply: As previously, the Average Cycle Time is determined by gathering data over one to two weeks for a typical process. % QualityThe quality rate is probably the simplest of the three sub-metrics and is given by the equation: In simple terms it is the percentage of all the entities produced in a given time that were produced correctly. If a defective entity is generated then effectively there is a loss of capacity of one good "A-Grade" entity. This kind of data is usually collected as a matter of course for most quality groups and a months worth of data more than suffices. Special CasesThe toughest part of OEE is deciding into which sub-category to place a capacity loss. Table 7.32.1 helps with the most common categorizations.
For some processes, the %Pace and %Quality are inextricably linked (by chemistry for instance) and the quality degrades as the pace is increased, because less time is given to the processing. In these cases, it is usually best to make a composite metric of Pace and Quality such as Kg of good product per hour. Uptime would still be dealt with separately. The new OEE equation is
An instantaneous best Rate of Quality Product would have to be identified from historical data, or calculated from basic scientific principles (mass continuity, and so on). Interpreting the OutputOEE yields two incredibly valuable pieces of information:
This information guides the next steps in the project. If the OEE is running at greater than 90%, then the process really doesn't have much opportunity to get better, or any change would be tricky to find. If, however, the OEE is less than 50%, which is common (the typical OEE value for a line is around 5%10%), then there is ample opportunity to apply a project to the process to capture some additional capacity. This assumes that there are additional sales for the capacity, because without it, the whole exercise is pretty much a waste of time. If additional potential capacity is identified, then the tool guides the Team to the best place to capture the capacity. The rule is always to take the easiest path. Unless there is a blindingly obvious shortfall in one category, it is often best to look in all three categories, because it is easier to find a percentage here and there, rather than to find it all in the same place. If looking to all three categories, then it is useful to have separate project streams for Uptime, Pace, and Quality. Two of these could perhaps be led by additional Green Belts working under the Black Belt, while the Black Belt takes the trickier category. Other OptionsOEE can also be applied to people, although this has to be dealt with carefully from an organizational viewpoint, not many employees like to examine the percentage of VA activity that they conduct. Application to a person is useful if that person is a constrained resource (generally with a scarce technical expertise). An example of this is shown in Figure 7.32.2 where a Diagnostic Technician conducts procedures in a room with specialized equipment. The OEE for the room and equipment is required as well as the OEE for the Technician, because the combined resources room, equipment, and technician are required to conduct a procedure. Figure 7.32.2. Example of interaction between loops.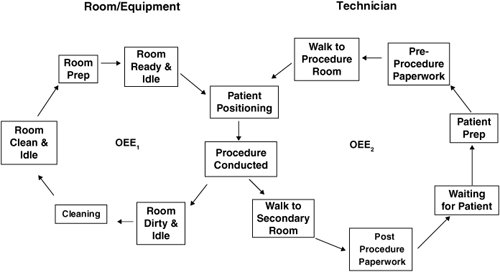 |
EAN: 2147483647
Pages: 138
- ERP Systems Impact on Organizations
- The Second Wave ERP Market: An Australian Viewpoint
- The Effects of an Enterprise Resource Planning System (ERP) Implementation on Job Characteristics – A Study using the Hackman and Oldham Job Characteristics Model
- Data Mining for Business Process Reengineering
- Intrinsic and Contextual Data Quality: The Effect of Media and Personal Involvement