Viewing Projects with PERT Charts
|
PERT refers to the Program Evaluation and Review Technique, a project management method originally developed in the 1950s by the U.S. Navy. A PERT chart is a diagram that reveals task, duration, and dependency information. Because of their ability to represent extensive detail, PERT charts continue to be popular today, particularly in manufacturing environments. With the PERT Chart template in Visio, you can create the style of chart variously called a network, subproject, or logic diagram. Visio doesn’t add a time scale or provide any automated tools for grouping or marking critical path tasks. Instead, you use drag-and- drop PERT shapes and connectors to assemble a diagram, and then type in the details, as Figure 12-8 shows.
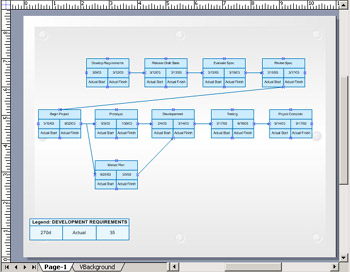
Figure 12-8: A PERT chart shows start and end dates for project tasks in a connected diagram.
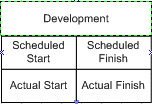
The PERT Chart template in Visio comes equipped with a deceptively small number of shapes, but you don’t need many to create even complex diagrams. However, you might need time. Visio doesn’t include wizards or other tools for automating the chart assembly process. You must type all the duration and task information you want to manage in a PERT shape, which represents one node—that is, a task, event, or activity associated with a project. Visio offers two styles of PERT shape, which differ only in the information they display, as Figure 12-9 shows. Both are groups. To connect each node to its successor, you use connectors from the stencil or toolbar.
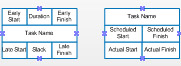
Figure 12-9: You can choose from two task styles by using either the PERT 1 (left) or PERT 2 (right) shape on the PERT Chart Shapes stencil.
Typically, a PERT chart ends at a major review point, such as the end of the analysis stage or a funding review cycle. You can insert pages and then create additional PERT charts to represent the components of an entire project.
| Tip | To delete text and leave the box empty, subselect the text box, and then press the Spacebar. |
Follow these steps to create a PERT chart:
-
Choose File, New, Project Schedule, PERT Chart.
-
Drag a PERT 1 or PERT 2 shape from the PERT Chart Shapes stencil onto the drawing page to create the first node.
-
With the shape selected, type the task name.
-
To add other task data, such as the scheduled start and finish dates, subselect a box in the PERT shape, and then type.
-
To add nodes for tasks in your project, drag PERT 1 and PERT 2 shapes onto the page.
-
To connect the nodes with arrows, click the Connector tool on the Standard toolbar, and then drag from the connection point on the first node shape to a connection point on the next shape.
-
Drag a Legend shape from the PERT Chart Shapes stencil onto the drawing page.
-
With the legend selected, type a title for the PERT chart.
-
To add additional data to the legend, subselect a box, and then type.
| Tip | Drawing with the Connector tool has exactly the same effect as using the Dynamic Connector shape on the PERT Chart Shapes stencil. Most people find it faster to use the Connector tool than the shape. |
Formatting lines
Project managers commonly indicate slack time between the end of one task and the start of another with a dotted line between tasks. Similarly, a thick line represents a critical path. To format lines in Visio, select a connector line shape, and then click the Line Pattern or Line Weight tool on the Formatting toolbar. Or choose Format, Line.
|
EAN: 2147483647
Pages: 209