Utilize a Network Intrusion Detection System
A network intrusion detection system is a machine or software that monitors network connections for signs of intrusion, denial of service, policy violations, or other unusual or user -specified activity. The network intrusion detection system (commonly referred to as NIDS) will watch a network or group of machines. It can be installed on a machine or be a completely separate component from the machines it is monitoring. This is in contrast to a host-based intrusion detection system, which typically monitors and is installed on a machine such as Tripwire, discussed in Chapter 14.
Install and Use Snort
Snort is the ubiquitous network intrusion detection system in the open source community today. It can be a network analyzer (or sniffer), network intrusion detection system, or packet logger depending on the setup. Snort has a very large following and is growing every day ”in fact, Snort has been so popular that it has spawned a commercial product. Before installing, you need to determine if you are going to have a database backend. There are a few benefits to having a database, such as searchable events as well as better performance. We won t be discussing setting up a database backend to Snort, as this is beyond the scope of this book. If you really want a database backend, see the excellent Snort documentation available at http://www.snort.org/docs/. You might want to consider the placement or whether you even want to run a network intrusion detection system on a production machine. A NIDS might be the first target of an attacker (internal or external) either through a denial of service or direct access to the machine. It is highly recommended that you do not run the NIDS on your production systems and that you create a dedicated, hardened machine specifically for NIDS purposes. The discussion of Snort in this book will be a brief overview of the setup and simple usage of some of Snort s features. For a much more in-depth discussion of Snort and the features it offers, see the Snort homepage at http://www.snort.org or purchase one of the books dedicated solely to the topic of Snort, such as Snort 2.0 Intrusion Detection (Syngress Publishing, 2003; ISBN 1931836744).
The first step is to download and install Snort from http://www.snort.org/dl/. You can install from rpm or from src . If installing from rpm , you can simply type
rpm -Uvh snort.x.x.x.rpm at the command line substituting x.x.x with the version numbers . If installing from source, you will need to do the following:
tar -zxf snort.2.1.1.tar.gz cd snort.2.1.1 ./configure make make install
Use Snort in Sniffing Mode
To use Snort in a sniffing mode, simply type snort -v and you will see output similar to the following (showing ping packets):
linux1:/ # snort -v Running in packet dump mode Log directory = /var/log/snort Initializing Network Interface eth0 --== Initializing Snort ==-- Initializing Output Plugins! Decoding Ethernet on interface eth0 --== Initialization Complete ==-- -*> Snort! <*- Version 2.1.1 (Build 24) By Martin Roesch (roesch@sourcefire.com, www.snort.org) 03/07-12:31:23.035680 ARP who-has 192.168.1.1 tell 192.168.1.100 03/07-12:31:23.038639 ARP reply 192.168.1.1 is-at 0:0:0:0:0:0 03/07-12:31:23.044477 192.168.1.100 -> 192.168.1.1 ICMP TTL:64 TOS:0x0 ID:0 IpLen:20 DgmLen:84 DF Type:8 Code:0 ID:32790 Seq:256 ECHO =+=+=+=+=+=+=+=+=+=+=+=+=+=+=+=+=+=+=+=+=+=+=+=+=+=+=+=+=+=+=+=+=+=+=+ 03/07-12:31:23.045126 192.168.1.1 -> 192.168.1.100 ICMP TTL:150 TOS:0x0 ID:0 IpLen:20 DgmLen:84 Type:0 Code:0 ID:32790 Seq:256 ECHO REPLY =+=+=+=+=+=+=+=+=+=+=+=+=+=+=+=+=+=+=+=+=+=+=+=+=+=+=+=+=+=+=+=+=+=+=+ -*> Snort! <*- ====================================================================== Snort analyzed 46 out of 46 packets, dropping 0(0.000%) packets Breakdown by protocol: Action Stats: TCP: 0 (0.000%) ALERTS: 0 UDP: 0 (0.000%) LOGGED: 0 ICMP: 2 (50.00%) PASSED: 0 ARP: 2 (50.00%) EAPOL: 0 (0.000%) IPv6: 0 (0.000%) IPX: 0 (0.000%) OTHER: 0 (0.000%) DISCARD: 0 (0.000%) ====================================================================== Wireless Stats: Breakdown by type: Management Packets: 0 (0.000%) Control Packets: 0 (0.000%) Data Packets: 0 (0.000%) ====================================================================== Fragmentation Stats: Fragmented IP Packets: 0 (0.000%) Fragment Trackers: 0 Rebuilt IP Packets: 0 Frag elements used: 0 Discarded(incomplete): 0 Discarded(timeout): 0 Frag2 memory faults: 0 ====================================================================== TCP Stream Reassembly Stats: TCP Packets Used: 0 (0.000%) Stream Trackers: 0 Stream flushes: 0 Segments used: 0 Stream4 Memory Faults: 0 ====================================================================== Snort exiting
To stop Snort, press CRTL-C and you will see the latter part with statistics on your session. This is very basic information and you will probably want to see more packet information, which can be done with the command snort -dev . To have the packet information logged to a file, use the -l option such as snort -dev -l /var/log/snort (make sure the /var/log/snort directory or whichever directory you choose exists). The files that are created in the log directory you choose are very obvious, so peruse them as needed.
Use Snort in Packet Capture Mode
Let s look at another interesting session as captured by Snort in packet capture mode (snort -dev):
=+=+=+=+=+=+=+=+=+=+=+=+=+=+=+=+=+=+=+=+=+=+=+=+=+=+=+=+=+=+=+=+=+=+=+ 03/07-16:26:17.923667 0:AA:11:BB:22:CC -> 01:01:01:01:01:01 type:0x800 len:0xA2 192.168.1.100:21 -> 192.168.1.1:33003 TCP TTL:64 TOS:0x0 ID:51120 IpLen:20 DgmLen:148 DF ***AP*** Seq: 0x2EEF469F Ack: 0x30CDB4A5 Win: 0x16A0 TcpLen: 32 TCP Options (3) => NOP NOP TS: 3440943 787726 32 32 30 20 55 6E 61 75 74 68 6F 72 69 7A 65 64 220 Unauthorized 20 61 63 63 65 73 73 20 70 72 6F 68 69 62 69 74 access prohibit 65 64 2E 20 41 6C 6C 20 75 73 65 20 69 73 20 6D ed. All use is m 6F 6E 69 74 6F 72 65 64 20 61 6E 64 20 75 6E 6C onitored and unl 61 77 66 75 6C 20 61 63 63 65 73 73 20 77 69 6C awful access wil 6C 20 62 65 20 72 65 70 6F 72 74 65 64 2E 0D 0A l be reported... =+=+=+=+=+=+=+=+=+=+=+=+=+=+=+=+=+=+=+=+=+=+=+=+=+=+=+=+=+=+=+=+=+=+=+ 03/07-16:26:17.923965 01:01:01:01:01:01 -> 0:AA:11:BB:22:CC type:0x800 len:0x42 192.168.1.1:33003 -> 192.168.1.100:21 TCP TTL:64 TOS:0x0 ID:0 IpLen:20 DgmLen:52 DF ***A**** Seq: 0x30CDB4A5 Ack: 0x2EEF46FF Win: 0xB68 TcpLen: 32 TCP Options (3) => NOP NOP TS: 787727 3440943 =+=+=+=+=+=+=+=+=+=+=+=+=+=+=+=+=+=+=+=+=+=+=+=+=+=+=+=+=+=+=+=+=+=+=+ 03/07-16:26:20.280752 01:01:01:01:01:01 -> 0:AA:11:BB:22:CC type:0x800 len:0x4D 192.168.1.1:33003 -> 192.168.1.100:21 TCP TTL:64 TOS:0x10 ID:0 IpLen:20 DgmLen:63 DF ***AP*** Seq: 0x30CDB4A5 Ack: 0x2EEF46FF Win: 0xB68 TcpLen: 32 TCP Options (3) => NOP NOP TS: 787963 3440943 55 53 45 52 20 6A 64 6F 65 0D 0A USER jdoe.. =+=+=+=+=+=+=+=+=+=+=+=+=+=+=+=+=+=+=+=+=+=+=+=+=+=+=+=+=+=+=+=+=+=+=+ 03/07-16:26:20.281611 0:AA:11:BB:22:CC -> 01:01:01:01:01:01 type:0x800 len:0x42 192.168.1.100:21 -> 192.168.1.1:33003 TCP TTL:64 TOS:0x0 ID:51121 IpLen:20 DgmLen:52 DF ***A**** Seq: 0x2EEF46FF Ack: 0x30CDB4B0 Win: 0x16A0 TcpLen: 32 TCP Options (3) => NOP NOP TS: 3441182 787963 =+=+=+=+=+=+=+=+=+=+=+=+=+=+=+=+=+=+=+=+=+=+=+=+=+=+=+=+=+=+=+=+=+=+=+ 03/07-16:26:20.281626 0:AA:11:BB:22:CC -> 01:01:01:01:01:01 type:0x800 len:0x64 192.168.1.100:21 -> 192.168.1.1:33003 TCP TTL:64 TOS:0x0 ID:51122 IpLen:20 DgmLen:86 DF ***AP*** Seq: 0x2EEF46FF Ack: 0x30CDB4B0 Win: 0x16A0 TcpLen: 32 TCP Options (3) => NOP NOP TS: 3441183 787963 33 33 31 20 50 6C 65 61 73 65 20 73 70 65 63 69 331 Please speci 66 79 20 74 68 65 20 70 61 73 73 77 6F 72 64 2E fy the password. 0D 0A .. =+=+=+=+=+=+=+=+=+=+=+=+=+=+=+=+=+=+=+=+=+=+=+=+=+=+=+=+=+=+=+=+=+=+=+ 03/07-16:26:20.281910 01:01:01:01:01:01 -> 0:AA:11:BB:22:CC type:0x800 len:0x42 192.168.1.1:33003 -> 192.168.1.100:21 TCP TTL:64 TOS:0x10 ID:0 IpLen:20 DgmLen:52 DF ***A**** Seq: 0x30CDB4B0 Ack: 0x2EEF4721 Win: 0xB68 TcpLen: 32 TCP Options (3) => NOP NOP TS: 787963 3441183 =+=+=+=+=+=+=+=+=+=+=+=+=+=+=+=+=+=+=+=+=+=+=+=+=+=+=+=+=+=+=+=+=+=+=+ 03/07-16:26:22.876297 ARP who-has 192.168.1.1 tell 192.168.1.1 03/07-16:26:22.879121 ARP reply 192.168.1.1 is-at 0:AA:11:BB:22:CC 03/07-16:26:24.851111 01:01:01:01:01:01 -> 0:AA:11:BB:22:CC type:0x800 len:0x51 192.168.1.1:33003 -> 192.168.1.100:21 TCP TTL:64 TOS:0x10 ID:0 IpLen:20 DgmLen:67 DF ***AP*** Seq: 0x30CDB4B0 Ack: 0x2EEF4721 Win: 0xB68 TcpLen: 32 TCP Options (3) => NOP NOP TS: 788420 3441183 50 41 53 53 20 73 65 6D 70 65 72 66 69 0D 0A PASS semperfi.. =+=+=+=+=+=+=+=+=+=+=+=+=+=+=+=+=+=+=+=+=+=+=+=+=+=+=+=+=+=+=+=+=+=+=+
Let s separate each section by the =+=+=+=+ line and view each packet. The first packet shows the FTP banner 220 Unauthorized access prohibited . All use is monitored and unlawful access will be reported. The third packet shows the user who is logging in, USER jdoe. The seventh packet shows our user s password, PASS semperfi.
Now, let s analyze a packet dump and figure out what everything means. For our example we will use the following packet:
03/07-16:26:24.851111 01:01:01:01:01:01 -> 0:AA:11:BB:22:CC type:0x800 len:0x51 192.168.1.1:33003 -> 192.168.1.100:21 TCP TTL:64 TOS:0x10 ID:0 IpLen:20 DgmLen:67 DF ***AP*** Seq: 0x30CDB4B0 Ack: 0x2EEF4721 Win: 0xB68 TcpLen: 32 TCP Options (3) => NOP NOP TS: 788420 3441183 50 41 53 53 20 73 65 6D 70 65 72 66 69 0D 0A PASS semperfi..
Table 11-7 shows the analysis.
| Packet Segment | Description |
|---|---|
| 03/07-16:26:24.851111 | Date and timestamp |
| 01:01:01:01:01 | Source hardware address (not always present) |
| 0:AA:11:BB:22:CC | Destination hardware address (not always present) |
| Type:0x800 | Type (not always present) |
| len:0x51 | Length (not always present) |
| 192.168.1.1 | Source IP address |
| :33003 | Port |
| 192.168.1.100 | Destination IP address |
| :21 | Destination port |
| TCP | Protocol |
| TTL:64 | Time to live |
| TOS:0x10 | Type of service |
| ID:0 | IP ID |
| IpLen:20 | Header length |
| DgmLen:67 | Datagram length |
| Frag Bits | DF |
| ***AP*** | TCP flags |
| Seq: 0x30CDB4B0 | TCP sequence |
| Ack: 0x2EEF4721 | TCP Ack |
| Win: 0xB68 | TCP window size |
| TcpLen: 32 | TCP header length |
| TCP Options (3) => NOP NOP TS: | TCP options |
| 50 41 53 53 20 73 65 6D 70 65 72 | Hex dump ASCII dump (PAYLOAD) |
To use Snort in intrusion detection mode, you will need to configure a file for full use. You will need to edit the /etc/snort/snort.conf file (it might be located in /etc/snort.conf). If you don t have a /etc/snort/snort.conf file, you will need to cd to the directory where you untarred your snort download file and run the following commands:
cd snort.2.1.1/etc cp snort.conf to /etc/snort/snort.conf
Use Snort in NIDS Mode
Snort in network intrusion detection system (NIDS) mode runs the packets collected against the preprocessors and plug-ins and runs it against the rule sets (signatures) for matches. You may also need to move your rules directory to a more central location. To do this, run the following command (substitute the destination to your preference):
cd /etc/snort/rules mkdir /usr/local/snort_rules mv * /usr/local/snort_rules/
Now edit your snort.conf file using your favorite editor and modify the variables listed in Table 11-8.
| Variable | Default | Description |
|---|---|---|
| HOME_NET | var HOME_NET any | Specify the internal network or network you are protecting in different formats as described in the file |
| EXTERNAL_NET | var EXTERNAL_NET any | Specify the external network |
| DNS_SERVERS | var DNS_SERVERS $HOME_NET | Specify your DNS servers |
| Server lists | Miscellaneous | Specify as fits your requirements |
| Service ports | Miscellaneous | Specify as fits your requirements |
| RULE_PATH | ../rules | Point them to your rules directory (in this case, |
| Rulesets | Miscellaneous | Edit which rules you want to include by removing or placing the # sign |
Now that we have everything set up, we are ready to run Snort in NIDS mode, which will log any packets that match the rules specified in /var/log/snort. You need to identify the home network or the network that Snort is protecting with the -h option. If your home network were 192.168.1.0, you would type - h 192.168.1.0/24 . If you wanted to run IDS mode, you would type this command to run Snort:
snort -dev -l /var/log/snort -h 192.168.1.0/24 -c /etc/snort.conf
This command will show all output to screen. If you plan on running Snort in IDS mode for a long period, you can just use -d without the ev options and then run it as a daemon with the -D option, which is far better for long- term operations. For the purposes of this chapter, we will leave the option as -dev .
Now that we have Snort running, let s take a look at some sample logs. From our previous command line, we told Snort to log to /var/log/snort. Our log directory of /var/log/snort has a couple of directories and files. The first set of subdirectories are IP addresses of the packet being locked and then divided by transport layer protocol and the source and destination ports from the connection. As shown in Figure 11-5, our second file is TCP:36016-15104, which shows this is the transport layer protocol (TCP), the source port (36016), and the destination port (15104).
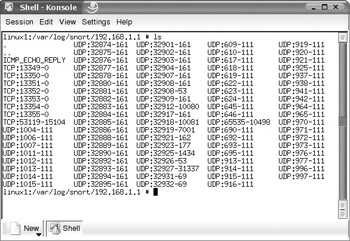
Figure 11-5: Snort-created directories
The initial log we will probably look at is the alert log located in the /var/log/snort directory. This gives you a quick glance at what is going on. Here is a sample from the alert file:
[**] [1:1616:4] DNS named version attempt [**] [Classification: Attempted Information Leak] [Priority: 2] 03/07-16:05:58.936992 01:01:01:01:01:01 -> 0:AA:11:BB:22:CC type:0x800 len:0x48 192.168.1.1:32908 -> 192.168.1.100:53 UDP TTL:64 TOS:0x0 ID:0 IpLen:20 DgmLen:58 DF Len: 30 [Xref => http://www.whitehats.com/info/IDS278] [Xref => http://cgi.nessus.org/plugins/dump.php3?id=10028] [**] [1:236:3] DDOS Stacheldraht client check gag [**] [Classification: Attempted Denial of Service] [Priority: 2] 03/07-16:05:59.073262 01:01:01:01:01:01 -> 0:AA:11:BB:22:CC type:0x800 len:0x3C 192.168.1.1 -> 192.168.1.100 ICMP TTL:64 TOS:0x0 ID:4660 IpLen:20 DgmLen:39 Type:0 Code:0 ID:668 Seq:0 ECHO REPLY [Xref => http://www.whitehats.com/info/IDS194] [**] [1:577:10] RPC portmap bootparam request UDP [**] [Classification: Decode of an RPC Query] [Priority: 2] 03/07-16:06:00.844683 01:01:01:01:01:01 -> 0:AA:11:BB:22:CC type:0x800 len:0x62 192.168.1.1:920 -> 192.168.1.100:111 UDP TTL:64 TOS:0x0 ID:0 IpLen:20 DgmLen:84 DF Len: 56 [Xref => http://www.whitehats.com/info/IDS16][Xref => http://cve.mitre.org/cgi-bin/cvename.cgi?name=CAN-1999-0647] [**] [1:584:8] RPC portmap rusers request UDP [**] [Classification: Decode of an RPC Query] [Priority: 2] 03/07-16:06:01.110363 01:01:01:01:01:01 -> 0:AA:11:BB:22:CC type:0x800 len:0x62 192.168.1.1:920 -> 192.168.1.100:111 UDP TTL:64 TOS:0x0 ID:0 IpLen:20 DgmLen:84 DF Len: 56 [Xref => http://www.whitehats.com/info/IDS133][Xref => http://cve.mitre.org/cgi-bin/cvename.cgi?name=CVE-1999-0626] [**] [1:249:3] DDOS mstream client to handler [**] [Classification: Attempted Denial of Service] [Priority: 2] 03/07-16:06:02.775998 01:01:01:01:01:01 -> 0:AA:11:BB:22:CC type:0x800 len:0x4A 192.168.1.1:53119 -> 192.168.1.100:15104 TCP TTL:64 TOS:0x0 ID:0 IpLen:20 DgmLen:60 DF ******S* Seq: 0xCB1D88BF Ack: 0x0 Win: 0x16D0 TcpLen: 40 TCP Options (5) => MSS: 1460 SackOK TS: 6321317 0 NOP WS: 0 [Xref => http://cve.mitre.org/cgi-bin/cvename.cgi?name=CAN-2000-0138] [Xref => http://www.whitehats.com/info/IDS111] [**] [1:237:2] DDOS Trin00 Master to Daemon default password attempt [**] [Classification: Attempted Denial of Service] [Priority: 2] 03/07-16:06:30.232819 01:01:01:01:01:01 -> 0:AA:11:BB:22:CC type:0x800 len:0x3C 192.168.1.1:1024 -> 192.168.1.100:27444 UDP TTL:255 TOS:0x0 ID:9 IpLen:20 DgmLen:39 Len: 11 [Xref => http://www.whitehats.com/info/IDS197]
If you wanted to view the payload of the packet, you could use the information contained in the packet and traverse to the more detailed information. Let s use the following packet and get more information (packet is from /var/log/snort/alert):
[**] [1:249:3] DDOS mstream client to handler [**] [Classification: Attempted Denial of Service] [Priority: 2] 03/07-16:06:02.775998 01:01:01:01:01:01 -> 0:AA:11:BB:22:CC type:0x800 len:0x4A 192.168.1.1:53119 -> 192.168.1.100:15104 TCP TTL:64 TOS:0x0 ID:0 IpLen:20 DgmLen:60 DF ******S* Seq: 0xCB1D88BF Ack: 0x0 Win: 0x16D0 TcpLen: 40 TCP Options (5) => MSS: 1460 SackOK TS: 6321317 0 NOP WS: 0 [Xref => http://cve.mitre.org/cgi-bin/cvename.cgi?name=CAN-2000-0138] [Xref => http://www.whitehats.com/info/IDS111]
If you want to view the payload of the file, you need to identify the source IP address, which is 192.168.1.1. This is a TCP packet and the source port and destination port are 53119 and 15104, respectively. So we know that the file that contains the detailed information about the packet would be located at /var/log/snort/192.168.1.1/TCP:53119-15104. Use the same logic when researching any file ”for instance, this file shows us the following:
[**] DDOS mstream client to handler [**] 03/07-16:06:02.775998 01:01:01:01:01:01 -> 0:AA:11:BB:22:CC type:0x800 len:0x4A 192.168.1.1:53119 -> 192.168.1.100:15104 TCP TTL:64 TOS:0x0 ID:0 IpLen:20 DgmLen:60 DF ******S* Seq: 0xCB1D88BF Ack: 0x0 Win: 0x16D0 TcpLen: 40 TCP Options (5) => MSS: 1460 SackOK TS: 6321317 0 NOP WS: 0 =+=+=+=+=+=+=+=+=+=+=+=+=+=+=+=+=+=+=+=+=+=+=+=+=+=+=+=+=+=+=+=+=+=+=+
If you wanted more information on the packet, you could visit the Common Vulnerabilities and Exposure database link shown at the bottom of the alert. For the alert we were just watching, you would visit cve.mitre.org/cgi-bin/cvename.cgi?name=CAN-2000-0138 or http://www.whitehats.com/info/IDS111/ for further information.
If you use the initial set of rules and run Snort out of the box, you are likely to see a lot of false alarms. You need to modify your rules as appropriate. In your /etc/snort/snort.conf file, you will see a section at the end containing a series of rule sets prefaced by include $RULE_PATH. You can disable a series of rules by commenting out or putting a # sign as the first character of the line of rules that you want disabled. If you don t want to disable an entire rule set, but only individual rules, you can go to the $RULE_PATH directory, which on our default system is in /etc/snort/rules, and open the file that corresponds to the rule set you want to edit. If you have an Oracle rule that keeps triggering and you know it is a false alarm, you can edit the /etc/snort/rules/oracle.rules. In that file you can find the specific rule you want to disable and place a # sign as the first character of the rule you want to disable. After adjusting the rules, you will need to restart Snort. Before removing or adding any rules, you should view the Snort documentation available at http://www.snort.org/docs/writing_rules/ to determine how to write and decipher rules.
Use Snort Add-ons
There are many add-ons to Snort, including web-based graphical front ends such as ACID and other tools to make the output of Snort easier to read. You can find all the Snort add-ons at http://www.snort.org/dl/ as well as very good documentation with step-by-step instructions at http://www.snort.org/docs/. If you are running a dedicated Snort machine, we recommend that you specifically check out a Snort+Apache+PHP+ACID+MySQL combination, which gives an outstanding graphical interface in a fast, easy to use setting. More information on the Snort, ACID, and MySQL setup is available at http://www.snort.org/docs/ in the Setup Guides section. One of the great strengths of Snort is the vast array of signature files created by volunteers. When an exploit is available, Snort signature writers usually have a signature to identify the packet almost immediately. To view the rule sets or to update your rules, visit http://www.snort.org/cgi-bin/done.cgi. You should read the documentation on network intrusion detection systems before deploying them, as they should not be installed haphazardly or without proper forethought. With a properly deployed and utilized network intrusion detection system, you increase your ability to detect attacks.
EAN: 2147483647
Pages: 113