Install a Network Analyzer
A network analyzer, sometimes generically called a sniffer (when capitalized, Sniffer is a registered trademark of Network Associates and refers to a specific product), is a program that collects and gathers all network traffic it has access to. These programs can be invaluable for discovering causes of network issues, determining the health of a network, and determining whether a malicious entity is attacking or has attacked your network. When a machine is set in promiscuous mode, the normal Ethernet hardware filtering is removed and the network interface collects all traffic on the network segment, allowing it to monitor all network traffic that passes the network interface. Network analyzers can be used both for good purposes, such as detecting network intrusions or troubleshooting the network, or for more nefarious purposes, such as obtaining user passwords or mapping network for attack. Remember that installing the software on your system can create vulnerability for you in that an attacker can gain access and use the tools against your network. Use these tools only on hardened hosts and if at all possible on non-production, network monitoring dedicated machines.
In this section, we discuss some of the more common network analyzer programs. The open source community is famous for its diverse set of applications that have similar functions, but offer different ways of doing those things. You will have to choose what program meets your needs and which you are comfortable with. For most of these programs you will need libpcap , which is a tool for capturing packets on your network interface. You may already have libpcap on your system, so determine if you do have it installed by running
rpm -q libpcap
If you have libpcap installed already, you will see a message similar to libpcap-0.7.1-56, otherwise you will receive an informational message stating package libpcap is not installed. If you do not have libpcap installed or you want to download the latest version, visit http://www. rpmfind .net to get the latest rpm for your platform or use the support site for your distribution to get the latest version, or visit http://www. sourceforge .net/projects/libpcap/ for the latest release of libpcap directly from the maintainers. Once you have downloaded the rpm, install it with the following code (replace libpcap-0.7.1-56.i586.rpm with the rpm name ):
rpm -Uvh libpcap-0.7.1-56.i586.rpm
Install and Use ngrep to Monitor the Network
ngrep (network grep) is a tool that mimics the functionality of the standard GNU grep command, but on a network level. This tool allows you to watch your network in real time, and separate packets based on specific parameters that you define in an easy-to-use format. You can install ngrep from CD if you are using SUSE, or you can find the rpm version of ngrep for your distribution at http://www.rpmfind.net. If you can t find or use the rpm version of ngrep , you can download the source at sourceforge.net/projects/ngrep/. After downloading ngrep , use the rpm command as follows to install the package:
rpm -Uvh ngrep-1.40-241.i586.rpm
ngrep has many different functions. The most common ones are shown in Table 11-1.
| Options | Meaning |
|---|---|
| -d | Use other device (not default device) |
| -h | Display help information on command use |
| -I | Ignore case, useful if you want to ignore the case of your ngrep |
| -q | Run quietly |
| -v | Don't match regex |
| -w | Word regular expressions (regex) |
| -x | Dump packet contents in hexadecimal and ASCII format |
| -X | Treat the expression as a hexadecimal string |
There are also some important qualifiers to assist getting more specific requests as shown in Table 11-2.
| Qualifier | Available Options | Examples |
|---|---|---|
| Type | host, net, and port | host linux1, net 192.168.1, port 80 |
| Dir | src, dst, or combination of both | src linux1, src or dst linux1, src and |
| proto | tcp, udp, icmp | tcp port 23 |
If you simply want to watch traffic as it goes through your network, just use this command:
ngrep
The output for someone going to a web site on the network followed by a ping command, for instance, would be similar to the following statements:
linux1:/ # ngrep interface: eth0 (192.168.1.0/255.255.255.0) ### T 192.168.1.1:32945 -> 192.168.1.100:80 [AP] GET / HTTP/1.1..Host: linux1..User-Agent: Mozilla/5.0 (X11; U; Linu x i686; en-US; rv:1.0.1) Gecko/20020903.. ###### I 192.168.1.1 -> 192.168.1.100 8:0 ......J@............................ !"#$%&'()*+,-./01234567
Let s dissect the output of ngrep in Table 11-3.
| Line Analyzed: T 192.168.1.1:32945 - > 192.168.1.100:80 [AP] | |
| Section of Line | Explanation |
|---|---|
| T | Shows the protocol in use, TCP = t, ICMP=I, UDP=U |
| 192.168.1.6 | Source IP |
| :32945 | Source port used |
| 192.168.1.101 | Destination IP |
| :80 | Destination port |
| [AP] | In this instance Ack Push |
| Line Analyzed: I 192.168.1.1 - > 192.168.1.100 8:0 | |
| Section of Line | Explanation |
| I | ICMP protocol |
| Source IP | 192.168.1.6 |
| Destination IP | 192.168.1.101 |
| 8:0 | Type 8 Code 0 (a ping request) |
Let s try a more complex ngrep command using some of the options described previously. We want to watch traffic from machine192.168.1.1 (source) going to 192.168.1.100 (destination) with a destination port of 80. We are specifically looking for traffic similar to the first output shown previously.
linux1:/ # ngrep port 80 and src host 192.168.1.1 and dst host 192.168.1.100 interface: eth0 (192.168.1.0/255.255.255.0) ### T 192.168.1.1:32945 -> 192.168.1.100:80 [AP] GET / HTTP/1.1..Host: linux1..User-Agent: Mozilla/5.0 (X11; U; Linux i686; en-US; rv:1.0.1) Gecko/20020903..
Make sure to use and between qualifiers to include them as the command will fail if you were to type ngrep port 80 src host 192.168.1.1 dst host 192.168.1.100 .
For easier-to-read output, try using ngrep -x as shown in the following output:
ngrep -x interface: eth0 (192.168.1.0/255.255.255.0) #### T 192.168.1.1:32967 -> 192.168.1.100:80 [AP] 47 45 54 20 2F 20 48 54 54 50 2F 31 2E 31 2E 2E GET / HTTP/1.1.. 48 6F 73 74 3A 20 6C 69 6E 75 78 31 2E 2E 55 73 Host: linux1..Us 65 72 2D 41 67 65 6E 74 3A 20 4D 6F 7A 69 6C 6C er-Agent:Mozill 61 2F 35 2E 30 20 28 58 31 31 3B 20 55 3B 20 4C a/5.0 (X11; U; L 69 6E 20 20 78 20 69 36 38 36 3B 20 65 6E 2D 55 inux i686; en-U 53 3B 20 72 76 3A 31 2E 30 2E 31 29 20 47 65 63 S;rv:1.0.1) Gec 6B 6F 2F 32 30 30 32 30 39 30 33 2E 2E D0 A0 00 ko/20020903..
When dealing with a large amount of output, this might be easier to read in real time, as the output in a columnar format. The first two columns of output are hexadecimal representation of the text and can be ignored unless needed. The third column is the actual ASCII information (packet) going through.
Here are a couple of other sample ngrep commands to show some of the usage of ngrep . The following searches for all telnet traffic (port 23):
ngrep port 23
The following searches for the login prompt on port 23 (telnet) from 192.168.1.1:
ngrep -q -t "ogin" port 23 and src host 192.168.1.1
| Note | The ngrep is only looking for ogin as opposed to Login. This is to ensure that a match happens for all instances, even if the initial L is dropped in transmission or whether the system is using an upper or lowercase L initially. |
There are multiple options when using ngrep and initially you will probably want to just watch some traffic or dump it to a file for review later. You can use many types of filters, including filters based on host, type, protocol, or direction of packet, or even exclude based on the same. To have the output of your ngrep command go to a file, use the following:
ngrep port 23 > /tmp/ngrep_logfile
Note that you will need to keep an eye on the logfile you send your output to, as it can get very large and take up significant amount of disk space if not monitored closely.
Install and Use tcpdump
tcpdump is simply a program that dumps all traffic headers passing along the network, as opposed to the entire packet. Most major distributions (including SUSE and Red Hat) have rpms available at http://www.rpmfind.net or on the distribution CD. If downloading the rpm , simply install by doing the following (depending on the filename):
rpm -Uvh tcpdump.3.8.1.1.i386.rpm
If rpm doesn t work for you or you prefer to build it yourself, you can download the source files from sourceforge.net/projects/tcpdump/ (currently tcpdump-3.8.1). If you take this route, you will need to install gcc, which is available at http://www.rpmfind.net as well. After downloading, install the source files with the following:
tar -zxf tcpdump-3.8.1.tar.gz cd tcpdump-3.8.1 ./configure make make install
tcpdump , as any other open source tool, has a multitude of options that it can be run with. Table 11-4 lists some of the more common options.
| Options | Meaning |
|---|---|
| -a | Convert network and broadcast addresses to an FQDN |
| -c | Stop after receiving a specific number of packets |
| -e | Print link-level header on every line |
| -I | Listen on specified interface |
| -l | Make stdout line buffered, so you can pipe the output to grep or tee |
| -N | Only print hostname instead of FQDN |
| -q | Print less detailed information (good for just identifying connections |
| -v | More verbose output |
| -vv | Even more verbose output |
| -vvv | Extremely verbose output |
| -w | Write raw packets to file |
As with ngrep , tcpdump has qualifiers, as identified in Table 11-5.
| Qualifier | Available Options | Examples |
|---|---|---|
| Type | host, net, and port | host linux1, net 192.168.1, port 80 |
| Dir | src, dst, or combination of both | src linux1, src or dst linux1, src, and |
| proto | ether , fddi, tr, ip, ip6, arp, rarp, decent, tcp, udp | tcp port 23 |
tcpdump can create a lot of output if no options are passed, but we should look at the standard output for a better understanding of what is available (telnet session).
| Note | Due to space constraints, some of the command output lines have to be adjusted with five spaces of indention throughout the rest of the chapter. This is not how the output will look when you run the command; the lines will simply wrap to the next line. linux1:/ #tcpdump tcpdump: verbose output suppressed, use -v or -vv for full protocol decode listening on eth0 09:03:35.842102 IP 192.168.1.1.32868 > 192.168.1.100.23: P 28:137(109) ack 52 win 5840 <nop,nop,timestamp 123456 1876543210> 09:03:35.919887 IP 192.168.1.100.23 > 192.168.1.1.32868: . ack 137 win 5792 <nop,nop,timestamp 1876543218 123456> 09:03:35.919902 IP 192.168.1.100.23 > 192.168.1.1.32868: P 52:55(3) ack 137 win 5792 <nop,nop,timestamp 1876543218 123456> 09:03:35.922717 IP 192.168.1.1.32868 > 192.168.1.100.23: P 137:140(3) ack 55 win 5840 <nop,nop,timestamp 123464 1876543218> 09:03:36.005509 IP 192.168.1.100.:S23 > 192.168.1.1.32868: P 55:85(30) ack 140 win 5792 <nop,nop,timestamp 1876543227 123464> 09:03:36.008526 IP 192.168.1.1.32868 > 192.168.1.100.23: P 140:143(3) ack 85 win 5840 <nop,nop,timestamp 123473 1876543227> 09:03:36.083412 IP 192.168.1.100.23 > 192.168.1.1.32868: P 85:92(7) ack 143 win 5792 <nop,nop,timestamp 1876543225 123473> 09:03:36.123182 IP 192.168.1.1.32868 > 192.168.1.100.23: . ack 92 win 5840 <nop,nop,timestamp 123493 1876543225> 09:03:42.790047 IP 192.168.1.1.32868 > 192.168.1.100.23: F 143:143(0) ack 92 win 5840 <nop,nop,timestamp 124125 1876543225> 09:03:42.863202 IP 192.168.1.100.23 > 192.168.1.1.32868: F 92:92(0) ack 144 win 5792 <nop,nop,timestamp 1876543907 124125> 09:03:42.863547 IP 192.168.1.1.32868 > 192.168.1.100.23: . ack 93 win 5840 <nop,nop,timestamp 541733 1876543907> |
The standard output format of a line from tcp protocol is source > destination: flags data-seqno ack window urgent options. The single line of output that follows is dissected in Table 11-6:
| Section of Line | Explanation |
|---|---|
| 09:03:35.842102 | Timestamp |
| IP | Internet Protocol |
| 192.168.1.1 | Source IP |
| .32868 | Source port |
| 192.168.1.100 | Destination IP |
| .23 | Destination port |
| P | TCP flag set |
| 28:137(109) | Sequence number (first:last) and amount of data in bytes |
| Ack 52 | Ack tcp flag |
| Win 5840 | Window size (5840 in this case) |
| <nop,nop,timestamp 541031 152328860> | Miscellaneous tcp options |
09:03:35.842102 IP 192.168.1.1.32868 > 192.168.1.100.23: P 28:137(109) ack 52 win 5840 <nop,nop,timestamp 541031 152328860>
Again, familiarity of TCP/IP is crucial to understand what you are seeing, but having previous knowledge of the protocols and a knowledge of your network allows you to get a better understanding of what is occurring on your network.
If you just want to use tcpdump to get some quick output, try using tcpdump with the -q option. The results of not using the -q option and using it are shown next. As usual, the command precedes the output. Here is the difference in output on a simple ping command:
linux1:/ # tcpdump 09:58:04.932897 IP 192.168.1.100 > 192.168.1.1: icmp 64: echo request seq 256 09:58:04.934294 IP 192.168.1.1 > 192.168.1.100: icmp 64: echo reply seq 256 09:58:04.949401 IP 192.168.1.100.32787 > 192.168.1.200.53: 19937+ PTR? 1.1.168.192.in-addr.arpa. (42) 09:58:04.962599 IP 192.168.1.200.53 > 192.168.1.100.32787: 19937 NXDomain 0/1/0 (129) 09:58:04.965071 IP 192.168.1.100.32787 > 192.168.1.200.53: 19938+ PTR? 200.1.168.192.in-addr.arpa. (42) 09:58:04.983159 IP 192.168.1.200.53 > 192.168.1.100.32787: 19938 1/2/2 PTR[domain] linux1:/tmp # tcpdump -q tcpdump: verbose output suppressed, use -v or -vv for full protocol decode listening on eth0 09:59:06.054203 IP 192.168.1.100 > 192.168.1.1: icmp 64: echo request seq 256 09:59:06.057390 IP 192.168.1.1 > 192.168.1.100: icmp 64: echo reply seq 256 09:59:06.105772 IP 192.168.1.100.32787 > 192.168.1.200.53: UDP, length: 42 09:59:06.122104 IP 192.168.1.200.53 > 192.168.1.100.32787: UDP, length: 129 09:59:06.142766 IP 192.168.1.100.32787 > 192.168.1.200.53: UDP, length: 42 09:59:06.157319 IP 192.168.1.200.53 > 192.168.1.100.32787: UDP, length: 165
The -q option simply provides less information, but is much easier to read when dealing with a large amount of data.
You might find that initially using the -q option will make it easier to get a very general overview of what is happening on your network as well as for gaining a better understanding of networking.
man tcpdump
| Tip | This program has an extremely well written and informative man page that should be referenced if you are looking to get more familiar with this tool. To see the man page, simply type man tcpdump . |
There are other tools to make the standard tcpdump command display easier to read, available at http://www. freshmeat .net using the search function with the keyword of tcpdump . tcpdump is a powerful tool, but it requires a high level of knowledge in networking concepts and protocols. If used properly, this tool can create a deeper understanding of the network and its effect on your Linux machine.
Okay, so this might seem like a lot of work for watching some pings , but the real value of tcpdump lies in the ability of the security administrator to audit the network. Let s look at an FTP session to see what information is passed. Using the -X option, we run tcpdump and monitor our FTP connection. Here is the output:
linux1:~ # tcpdump -X tcpdump: verbose output suppressed, use -v or -vv for full protocol decode listening on eth0, link-type EN10MB (Ethernet), capture size 96 bytes 15:19:38.495492 IP 192.168.1.1.32781 > 192.168.1.200.domain: 21882+ PTR? 100.1.168.192.in-addr.arpa. (44) 0x0000 4500 0048 0000 4000 4011 74c3 c0a8 0106 E..H..@.@.t..... 0x0010 442e c005 800d 0035 0034 a53b 557a 0100 D......5.4.;Uz.. 0x0020 0001 0000 0000 0000 0331 3030 0131 0331 .........100.1.1 0x0030 3638 0331 3932 0769 6e2d 6164 6472 0461 68.192.in-addr.a 0x0040 7270 6100 000c 0001 rpa..... 15:19:38.506474 IP 192.168.1.200.domain > 192.168.1.1.32781: 21882 NXDomain 0/1/0 (131) 0x0000 4500 009f 5af7 4000 fd11 5c74 442e c005 E...Z.@...\tD... 0x0010 c0a8 0106 0035 800d 008b 9a91 557a 8183 .....5......Uz.. 0x0020 0001 0000 0001 0000 0331 3030 0131 0331 .........100.1.1 0x0030 3638 0331 3932 0769 6e2d 6164 6472 0461 68.192.in-addr.a 0x0040 7270 6100 000c 0001 c012 0006 0001 0000 rpa............. 0x0050 128c .. 15:19:38.508051 IP 192.168.1.1.32966 > 192.168.1.100.ftp: S 890269150:890269150(0) win 5840 <mss 1460,sackOK,timestamp 387786 0,nop,wscale 1> 0x0000 4500 003c 0000 4000 4006 b701 c0a8 0106 E..<..@.@....... 0x0010 c0a8 0164 80c6 0015 3510 6dde 0000 0000 ...d....5.m..... 0x0020 a002 16d0 9ee1 0000 0204 05b4 0402 080a ................ 0x0030 0005 eaca 0000 0000 0103 0301 ............ 15:19:38.516858 IP 192.168.1.100.ftp > 192.168.1.1.32966: S 852782868:852782868(0) ack 890269151 win 5792 <mss 1460,sackOK,timestamp 3027262 387786,nop,wscale 0> 0x0000 4500 003c 0000 4000 4006 b701 c0a8 0164 E..<..@.@......d 0x0010 c0a8 0106 0015 80c6 32d4 6f14 3510 6ddf ........2.o.5.m. 0x0020 a012 16a0 cbac 0000 0204 05b4 0402 080a ................ 0x0030 002e 313e 0005 eaca 0103 0300 ..1>........ 15:19:38.517185 IP 192.168.1.1.32966 > 192.168.1.100.ftp: . ack 1 win 2920 <nop,nop,timestamp 387787 3027262> 0x0000 4500 0034 0000 4000 4006 b709 c0a8 0106 E..4..@.@....... 0x0010 c0a8 0164 80c6 0015 3510 6ddf 32d4 6f15 ...d....5.m.2.o. 0x0020 8010 0b68 05a9 0000 0101 080a 0005 eacb ...h............ 0x0030 002e 313e ..1> 15:19:38.526500 IP 192.168.1.100.ftp > 192.168.1.1.32966: P 1:21(20) ack 1 win 5792 <nop,nop,timestamp 3027263 387787> 0x0000 4500 0048 5e2a 4000 4006 58cb c0a8 0164 E..H^*@.@.X....d 0x0010 c0a8 0106 0015 80c6 32d4 6f15 3510 6ddf ........2.o.5.m. 0x0020 8018 16a0 a344 0000 0101 080a 002e 313f .....D........1? 0x0030 0005 eacb 3232 3020 2876 7346 5450 6420 ....220.(vsFTPd. 0x0040 312e 322e 3029 0d0a 1.2.0).. 15:19:38.526841 IP 192.168.1.1.32966 > 192.168.1.100.ftp: . ack 21 win 2920 <nop,nop,timestamp 387788 3027263> 0x0000 4510 0034 0000 4000 4006 b6f9 c0a8 0106 E..4..@.@....... 0x0010 c0a8 0164 80c6 0015 3510 6ddf 32d4 6f29 ...d....5.m.2.o) 0x0020 8010 0b68 0593 0000 0101 080a 0005 eacc ...h............ 0x0030 002e 313f ..1? 15:19:38.542083 IP 192.168.1.200.domain > 192.168.1.1.32782: 45715 NXDomain 0/1/0 (131) 0x0000 4500 009f 5af9 4000 fd11 5c72 442e c005 E...Z.@...\rD... 0x0010 c0a8 0106 0035 800e 008b 3d77 b293 8183 .....5....=w.... 0x0020 0001 0000 0001 0000 0331 3030 0131 0331 .........100.1.1 0x0030 3638 0331 3932 0769 6e2d 6164 6472 0461 68.192.in-addr.a 0x0040 7270 6100 000c 0001 c012 0006 0001 0000 rpa............. 0x0050 128c .. 15:19:42.017006 IP 192.168.1.1.32966 > 192.168.1.100.ftp: P 1:17(16) ack 21 win 2920 <nop,nop,timestamp 388137 3027263> 0x0000 4510 0044 0000 4000 4006 b6e9 c0a8 0106 E..D..@.@....... 0x0010 c0a8 0164 80c6 0015 3510 6ddf 32d4 6f29 ...d....5.m.2.o) 0x0020 8018 0b68 7c41 0000 0101 080a 0005 ec29 ...hA.........) 0x0030 002e 313f 5553 4552 2061 6e6f 6e79 6d6f ..1?USER.anonymo 0x0040 7573 0d0a us.. 15:19:42.026889 IP 192.168.1.100.ftp > 192.168.1.1.32966: . ack 17 win 5792 <nop,nop,timestamp 3027614 388137> 0x0000 4500 0034 5e2b 4000 4006 58de c0a8 0164 E..4^+@.@.X....d 0x0010 c0a8 0106 0015 80c6 32d4 6f29 3510 6def ........2.o)5.m. 0x0020 8010 16a0 f78e 0000 0101 080a 002e 329e ..............2. 0x0030 0005 ec29 ...) 15:19:42.026912 IP 192.168.1.100.ftp > 192.168.1.1.32966: P 21:55(34) ack 17 win 5792 <nop,nop,timestamp 3027614 388137> 0x0000 4500 0056 5e2c 4000 4006 58bb c0a8 0164 E..V^,@.@.X....d 0x0010 c0a8 0106 0015 80c6 32d4 6f29 3510 6def ........2.o)5.m. 0x0020 8018 16a0 b043 0000 0101 080a 002e 329e .....C........2. 0x0030 0005 ec29 3333 3120 506c 6561 7365 2073 ...)331.Please.s 0x0040 7065 6369 6679 2074 6865 2070 6173 7377 pecify.the.passw 0x0050 6f72 or 15:19:42.027281 IP 192.168.1.1.32966 > 192.168.1.100.ftp: . ack 55 win 2920 <nop,nop,timestamp 388138 3027614> 0x0000 4510 0034 0000 4000 4006 b6f9 c0a8 0106 E..4..@.@....... 0x0010 c0a8 0164 80c6 0015 3510 6def 32d4 6f4b ...d....5.m.2.oK 0x0020 8010 0b68 02a4 0000 0101 080a 0005 ec2a ...h...........* 0x0030 002e 329e ..2. 15:19:43.486412 arp who-has 192.168.1.1 tell 192.168.1.1 0x0000 0001 0800 0604 0001 0003 ff32 5e38 c0a8 ...........2^8.. 0x0010 0106 0000 0000 0000 c0a8 0101 ............ 5:19:43.489420 IP 192.168.1.1.32782 > 192.168.1.200.domain: 45716+ PTR? 1.1.168.192.in-addr.arpa. (42) 0x0000 4500 0046 0000 4000 4011 74c5 c0a8 0106 E..F..@.@.t..... 0x0010 442e c005 800e 0035 0032 7a54 b294 0100 D......5.2zT.... 0x0020 0001 0000 0000 0000 0131 0131 0331 3638 .........1.1.168 0x0030 0331 3932 0769 6e2d 6164 6472 0461 7270 .192.in-addr.arp 0x0040 6100 000c 0001 a..... 15:19:43.490284 arp reply 192.168.1.1 is-at 00:0c:41:45:9a:18 0x0000 0001 0800 0604 0002 000c 4145 9a18 c0a8 ..........AE.... 0x0010 0101 0003 ff32 5e38 c0a8 0106 0000 0000 .....2^8........ 0x0020 0000 0000 0000 0000 0000 0000 0000 .............. 15:19:43.505854 IP 192.168.1.200.domain > 192.168.1.1.32782: 45716 NXDomain 0/1/0 (129) 0x0000 4500 009d 5afa 4000 fd11 5c73 442e c005 E...Z.@...\sD... 0x0010 c0a8 0106 0035 800e 0089 7395 b294 8183 .....5....s..... 0x0020 0001 0000 0001 0000 0131 0131 0331 3638 .........1.1.168 0x0030 0331 3932 0769 6e2d 6164 6472 0461 7270 .192.in-addr.arp 0x0040 6100 000c 0001 c010 0006 0001 0000 0ea3 a............... 0x0050 004b .K 15:19:46.351612 IP 192.168.1.1.32966 > 192.168.1.100.ftp: P 17:32(15) ack 55 win 2920 <nop,nop,timestamp 388570 3027614> 0x0000 4510 0043 0000 4000 4006 b6ea c0a8 0106 E..C..@.@....... 0x0010 c0a8 0164 80c6 0015 3510 6def 32d4 6f4b ...d....5.m.2.oK 0x0020 8018 0b68 8a6d 0000 0101 080a 0005 edda ...h.m.......... 0x0030 002e 329e 5041 5353 2070 6173 7377 6f72 ..2.PASS.passwor 0x0040 640d 0a d.. 1 5:19:46.358216 IP 192.168.1.100.ftp > 192.168.1.1.32966: P 55:78(23) ack 32 win 5792 <nop,nop,timestamp 3028050 388570> 05 800e 0035 0032 7a54 b294 0100 D......5.2zT.... 0x0020 0001 0000 0000 0000 0131 0131 0331 3638 .........1.1.168 0x0030 0331 3932 0769 6e2d 6164 6472 0461 7270 .192.in-addr.arp 0x0040 6100 000c 0001 a..... 15:19:43.490284 arp reply 192.168.1.1 is-at 00:0c:41:45:9a:18 0x0000 0001 0800 0604 0002 000c 4145 9a18 c0a8 ..........AE.... 0x0010 0101 0003 ff32 5e38 c0a8 0106 0000 0000 .....2^8........ 0x0020 0000 0000 0000 0000 0000 0000 0000 .............. 15:19:43.505854 IP 192.168.1.200.domain > 192.168.1.1.32782: 45716 NXDomain 0/1/0 (129) 0x0000 4500 009d 5afa 4000 fd11 5c73 442e c005 E...Z.@...\sD... 0x0010 c0a8 0106 0035 800e 0089 7395 b294 8183 .....5....s..... 0x0020 0001 0000 0001 0000 0131 0131 0331 3638 .........1.1.168 0x0030 0331 3932 0769 6e2d 6164 6472 0461 7270 .192.in-addr.arp 0x0040 6100 000c 0001 c010 0006 0001 0000 0ea3 a............... 0x0050 004b .K 15:19:46.351612 IP 192.168.1.1.32966 > 192.168.1.100.ftp: P 17:32(15) ack 55 win 2920 <nop,nop,timestamp 388570 3027614> 0x0000 4510 0043 0000 4000 4006 b6ea c0a8 0106 E..C..@.@....... 0x0010 c0a8 0164 80c6 0015 3510 6def 32d4 6f4b ...d....5.m.2.oK 0x0020 8018 0b68 8a6d 0000 0101 080a 0005 edda ...h.m.......... 0x0030 002e 329e 5041 5353 2070 6173 7377 6f72 ..2.PASS.passwor 0x0040 640d 0a d.. 15:19:46.358216 IP 192.168.1.100.ftp > 192.168.1.1.32966: P 55:78(23) ack 32 win 5792 <nop,nop,timestamp 3028050 388570> 0x0000 4500 004b 5e2d 4000 4006 58c5 c0a8 0164 E..K^-@.@.X....d 0x0010 c0a8 0106 0015 80c6 32d4 6f4b 3510 6dfe ........2.oK5.m. 0x0020 8018 16a0 1261 0000 0101 080a 002e 3452 .....a........4R 0x0030 0005 edda 3233 3020 4c6f 6769 6e20 7375 ....230.Login.su 0x0040 6363 6573 7366 756c 2e0d 0a ccessful...
The tcpdump -X shows a sample FTP connection login and then tcpdump was exited. Granted, that is a lot of output, but this is what occurs when you do an FTP. If you peruse the entire output, you might notice a few interesting tidbits of information. Recall that we were using FTP, which is not encrypted. Now take a look at three sets of packets taken from the previous output:
15:19:38.526500 IP 192.168.1.100.ftp > 192.168.1.1.32966: P 1:21(20) ack 1 win 5792 <nop,nop,timestamp 3027263 387787> 0x0000 4500 0048 5e2a 4000 4006 58cb c0a8 0164 E..H^*@.@.X....d 0x0010 c0a8 0106 0015 80c6 32d4 6f15 3510 6ddf ........2.o.5.m. 0x0020 8018 16a0 a344 0000 0101 080a 002e 313f .....D........1? 0x0030 0005 eacb 3232 3020 2876 7346 5450 6420 ....220.(vsFTPd. 0x0040 312e 322e 3029 0d0a 1.2.0)..
This shows that our ftp server (192.168.1.100) is running vsftpd 1.2.0 (look at line 0x0030 and 0x0040). This is not anything really private, as it is advertised whenever anyone FTPs to the server, but it should be removed to make it just a little harder for an attacker.
15:19:42.017006 IP 192.168.1.1.32966 > 192.168.1.100.ftp: P 1:17(16) ack 21 win 2920 <nop,nop,timestamp 388137 3027263> 0x0000 4510 0044 0000 4000 4006 b6e9 c0a8 0106 E..D..@.@....... 0x0010 c0a8 0164 80c6 0015 3510 6ddf 32d4 6f29 ...d....5.m.2.o) 0x0020 8018 0b68 7c41 0000 0101 080a 0005 ec29 ...hA.........) 0x0030 002e 313f 5553 4552 2061 6e6f 6e79 6d6f ..1?USER.anonymo 0x0040 7573 0d0a us..
This shows that we passed anonymous as the username (look at line 0x0030).
15:19:46.351612 IP 192.168.1.1.32966 > 192.168.1.100.ftp: P 17:32(15) ack 55 win 2920 <nop,nop,timestamp 388570 3027614> 0x0000 4510 0043 0000 4000 4006 b6ea c0a8 0106 E..C..@.@....... 0x0010 c0a8 0164 80c6 0015 3510 6def 32d4 6f4b ...d....5.m.2.oK 0x0020 8018 0b68 8a6d 0000 0101 080a 0005 edda ...h.m.......... 0x0030 002e 329e 5041 5353 2070 6173 7377 6f72 ..2.PASS.passwor 0x0040 640d 0a d..
Now we can see the password is password (look at lines 0x0030 and 0x0040). From this tcpdump , an attacker would be able to gain a user s login name and password and the version of FTP server they were using (you could get this by simply FTP-ing, though, as it is the header information). Imagine if this were a real user account and password and what the implications of that would be. An encrypted session (SSH, SCP, SFTP, and so on) would show garbled text and would be unrecognizable.
Install Ethereal
Ethereal (the Ethereal Network Analyzer) is a more user-friendly, graphical version of tcpdump with the same functionality. Ethereal is the de facto standard network analyzer in the open source community today, and with good reason. It supports many, many protocols, different output formats as well as other interesting options.
Ethereal is available on most Linux distributions, but if needed, you can find the rpm s available at http://www.rpmfind.net and install with the rpm -Uvh command, or get it directly from http://www.ethereal.com. After installation, type the following to run Ethereal in the background:
ethereal &
After typing ethereal , you will see a screen similar to Figure 11-1.
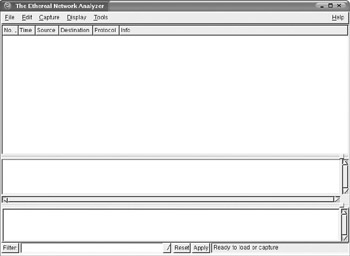
Figure 11-1: Ethereal startup screen
In this section on Ethereal, we will not be covering the full gamut of options that are available, so we recommend that you visit http://www.ethereal.com/docs/user-guide/ for a full tutorial on the usage and capabilities of Ethereal.
To see a real-time capture of packets as they cross your network, you need to go to the Capture menu and click Start. You will be presented with the next screen of options related to packet captures, shown in Figure 11-2.
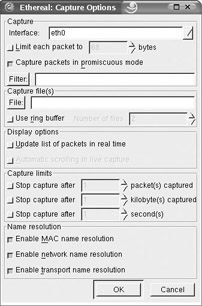
Figure 11-2: Ethereal Capture options
For real-time captures, select Update List Of Packets In Real Time. You can select Automatic Scrolling In Live Capture if you want scrolling enabled. After selecting any other options you require, click OK to start capturing packets. A new window showing statistics on packet capture will appear similar to Figure 11-3.
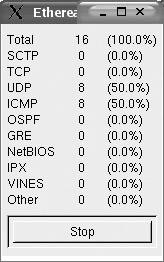
Figure 11-3: Ethereal protocol statistics
As packets start being collected, you will see the information displayed in the packet list pane. Figure 11-4 shows a ping request and reply.
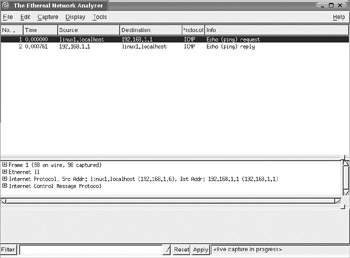
Figure 11-4: Ethereal packet capture
Ethereal supports filtering similar to that described in tcpdump as well as many other options for displaying packets in an easier-to-read format, name resolution, multiple save options, and analysis options. You can import reports generated by other programs such as tcpdump into the graphical interface provided by Ethereal for easier analysis. Ethereal also has the ability to filter traffic with the Display Filters mechanism, allowing you to see only the traffic you want. This feature is accessible from the Edit menu under Display Filters. More documentation on this functionality is available at www.ethereal.com/docs/man-pages/ethereal-filter.4.html and http://www.ethereal.com/docs/dfref/.
Before using Ethereal, you should become familiar with the command line tools, as you will not always have access to a graphical user interface in times of need. Knowing and understanding the command line network analyzers will allow you to immediately determine if a situation exists or if there are anomalies on the network.
EAN: 2147483647
Pages: 113
- The Four Keys to Lean Six Sigma
- Key #1: Delight Your Customers with Speed and Quality
- Key #4: Base Decisions on Data and Facts
- Making Improvements That Last: An Illustrated Guide to DMAIC and the Lean Six Sigma Toolkit
- The Experience of Making Improvements: What Its Like to Work on Lean Six Sigma Projects