Fault Detection Tools
| I l @ ve RuBoard |
| This section describes products that can be used to detect application failures. Additional tools for monitoring application performance are discussed later in the chapter. IT/OperationsIT/Operations (IT/O) is a sophisticated management product for system operators. Systems in the enterprise can be displayed on maps onscreen, with colors representing their current status. An Application Bank is included for default and customized tools that can be launched from a particular system. Events can be sent from systems throughout the enterprise, and configured recovery actions can then be taken. IT/O can also be used to monitor specified components on a managed system. Some predefined monitors are provided, one of which has the ability to monitor specific processes. An event is sent to the IT/O console if a process fails. A recovery action can be configured to restart the application. Although IT/O can detect an application failure and restart the application, it does not have sufficient high availability capabilities to move an application to another system or ensure that only one copy is running. More extensive high availability capabilities are provided by MC/ServiceGuard, which is discussed next . MC/ServiceGuardMC/ServiceGuard is a high availability product from Hewlett-Packard that is used to protect your critical applications and servers. MC/ServiceGuard is most commonly used in a multisystem (cluster) environment. The MC/ServiceGuard software on each system monitors the other systems in the cluster. MC/ServiceGuard can detect the failure of systems, networks, and applications. For example, MC/ServiceGuard can recover transparently from a LAN failure. After deciding which applications need to be protected, you configure them as packages by using MC/ServiceGuard commands or the graphical interface accessible from SAM. Numerous attributes of the application need to be defined, such as the following:
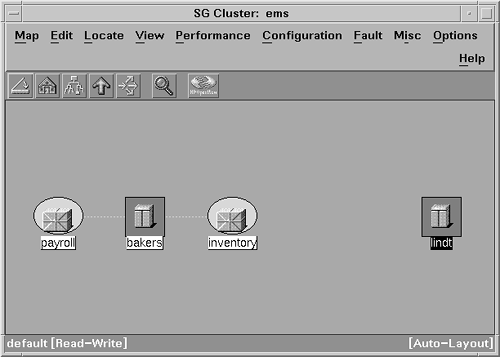
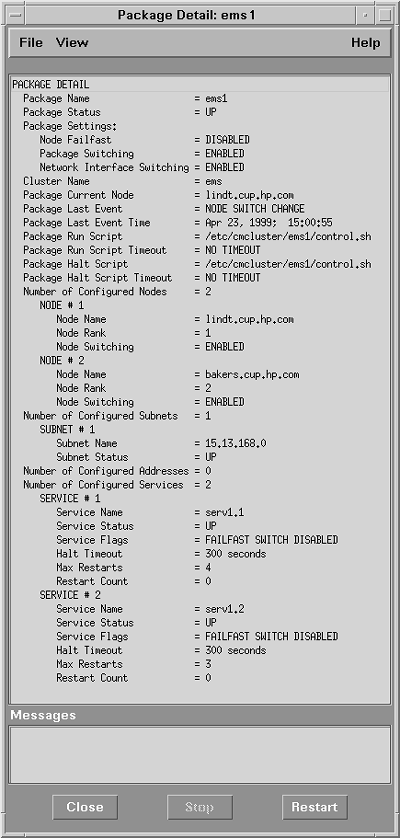
MC/ServiceGuard then monitors these services and dependencies. If a failure occurs, the package is either restarted locally or moved and restarted on another system. Similarly, when a system failure occurs, MC/ServiceGuard software can detect the problem and automatically restart critical applications on an alternate node. MC/ServiceGuard software detects a variety of error conditions, but does not have a sophisticated notification mechanism for you to learn what happened. Errors are often written to the system log file, which helps retrace what happened . Because MC/ServiceGuard can automatically move applications to other systems, it may be difficult for you to know the current status of your application. MC/ServiceGuard commands, such as cmviewcl, can tell you the current state of a cluster and its packages. The HP MC/ServiceGuard MIB also contains this information. However, a package can be moved for a variety of reasons, and MC/ServiceGuard doesn't tell you the reason. You may want to check the system log file (/var/adm/syslog/syslog.log) on each cluster system for its specific MC/ServiceGuard activity. An example of the events logged to the system log file during a package failover is shown in Listing 7-4. In the example, cake is the system name, and cmcld is part of the MC/ServiceGuard product. The package failed because a service on which it depended failed. Not all applications work well in an MC/ServiceGuard environment. For example, applications that use the gethostname() system call may not work properly after the application is moved to another node. MC/ServiceGuard provides a list of application guidelines that should be followed. About 100 applications have been specifically tested with MC/ServiceGuard, either by an HP organization or by the application's company. These applications include many of the key applications described in this book, such as BMC PATROL, Unicenter TNG, PeopleSoft, SAP R/3, and Baan Triton. In addition to certifying applications, MC/ServiceGuard provides optional application toolkits for specific applications, such as HA NFS and HA DCE. Note that MC/ServiceGuard is supported only on HP 9000 Series 800 systems running HP-UX 10. x or later operating systems. ClusterViewYou can use the ClusterView product to help with diagnoses in high availability environments. ClusterView is an OpenView application with custom monitoring capabilities for MC/ServiceGuard and MC/LockManager clusters. ClusterView requires NNM or IT/O. ClusterView relies on a high availability SNMP subagent, which is included with the MC/ServiceGuard and MC/LockManager products. It can be used to send events to an OpenView management station. These SNMP traps can actually be received by any management station that understands SNMP (such as Computer Associates' Unicenter product). These events are received in NNM's Event Browser. If the subagent is running on an IT/O-managed system, it automatically detects the IT/O software and sends events by using the proprietary IT/O Remote Procedure Call (RPC) mechanism, which is more reliable than SNMP traps. ClusterView can be used to graphically show application status. Color is used to represent status, and a line is used to link an application to the system on which it is running. Because applications can be moved manually or automatically, this link is important for finding an application's current location. ClusterView does not show any resource or performance problems that may exist for an application. Other tools must be used to provide that capability. Figure 7-1 shows how ClusterView displays the application packages configured in an MC/ServiceGuard cluster. Lines connect the packages to the systems on which they are running. Figure 7-1. ClusterView showing application packages. Listing 7-4 syslog output showing a package failover.Apr 23 15:17:48 cake cmcld[983]: Service PKG*4172 terminated due to an exit(0). Apr 23 15:17:48 cake cmcld[983]: Halted package ems1 on node cake. Apr 23 15:17:48 cake cmcld[983]: Package ems1 cannot run on this node because switching has been disabled for this node. Apr 23 15:17:54 cake cmcld[983]: (tart) Started package ems1 on node tart. ClusterView provides additional capabilities when used with IT/O. The SNMP events are sent to the Event Browser, where ClusterView provides special troubleshooting instructions and recommends actions to help resolve the problems. Some data collection activities are done automatically. For example, in response to a package failure, ClusterView automatically retrieves the system's system log file entries from the time of failure to aid in diagnosis. Common HP-UX monitoring tools, such as netstat and lanscan, are included by ClusterView in IT/O's Application Bank, along with MC/ServiceGuard-specific tools, such as cmviewcl. For each cluster, node, or package that is shown on an OpenView submap, the operator can view an additional detail screen. The detail information is obtained by querying the HP MC/ServiceGuard MIB on the cluster. An example package detail screen is shown in Figure 7-2. The package details can tell you alternate systems on which the package is configured to run. Figure 7-2. Output from ClusterView package detail screen. In addition to high availability clusters, ClusterView can monitor user -defined clusters. ClusterView provides a configuration tool that enables administrators to create a cluster, which Cluste-View will then display on a cluster submap. For example, you may want to group all of your systems running Informix into an Informix cluster. The operator can then monitor all the clustered systems at a glance, because they are all in the same OpenView submap. Also, the operator can launch monitoring tools such as HP PerfView on the cluster, avoiding the need to select each system manually when running each tool. ClusterView runs on HP-UX and Windows NT systems. The ClusterView software for either platform can also be used to monitor Microsoft's NT Cluster Servers, its high availability clusters. Both NT and MC/ServiceGuard clusters can be monitored concurrently from the same ClusterView software. Event Monitoring ServiceAs mentioned earlier, MC/ServiceGuard can monitor and migrate application packages. However, its application monitoring is limited to determining whether an application is running or has failed. MC/ServiceGuard relies on the Event Monitoring Service (EMS) to monitor additional components that are important to the application. The application package may be dependent on a resource, such as a disk volume. Any package dependencies are specified when the package is initially configured. When the package is started by MC/ServiceGuard, EMS begins continual monitoring of each resource. EMS can report resource problems to MC/ServiceGuard so that an application can be restarted. EMS can also report important events to a log file or management station. This can aid in troubleshooting, because the operator can receive information about the specific component that failed (instead of simply learning that an application was restarted, with no explanatory text). A variety of events can be reported by EMS. Several networking links have customized monitors. A database monitor is available to monitor Oracle server status. The disk monitor can report logical and physical volume status information. All EMS monitors can be used with or without the MC/ServiceGuard product. EMS also provides a software developer's kit that enables you to write your own monitor and use it along with other monitors. In this way, you can provide custom monitoring for your own homegrown application. EMS is available only for HP-UX platforms. EcoSNAPCompuware 's EcoSNAP (formerly called Fault-XPERT) is another tool for detecting application failures. EcoSNAP is used to detect and troubleshoot application failures, both in production and during product development. Similar to MC/ServiceGuard, no application changes are required for EcoSNAP to be able to monitor and detect failures. Faults are reported to a console, and additional details that can aid in diagnosis can be provided along with a fault notification. EcoSNAP can also be configured to take certain actions when an application fails. In general, applications are started by the EcoSNAP starter program. If an application is already running, monitoring can be started by executing a special EcoSNAP command. EcoSNAP consists of four modules:
By providing fault information, such as stack traces, EcoSNAP can help in diagnosing problems with an application. Multiple applications can be monitored simultaneously . EcoSNAP works by detecting Unix signals that cause an application to fail. These signals are then trapped, and program diagnostic information is captured before the application actually terminates. This information is later made available through a GUI that enables the user to drill down on an individual fault. The following set of Unix signals and abnormal termination errors can be detected by EcoSNAP:
EcoSNAP runs on Sun Solaris, HP-UX, IBM AIX, and other platforms. More informa tion about EcoSNAP can be obtained from Compuware Corporation's Web site at http://www.compuware.com. |
| I l @ ve RuBoard |
EAN: 2147483647
Pages: 90

