Using System Instrumentation
| I l @ ve RuBoard |
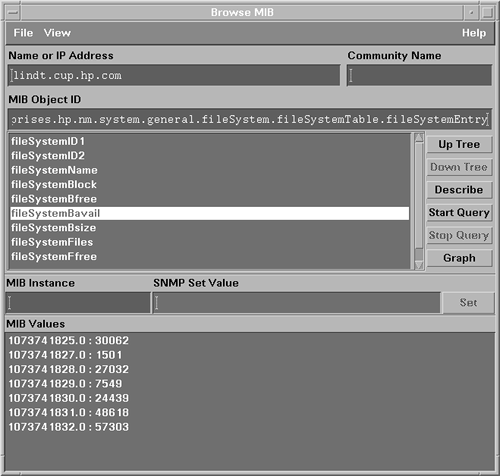
| Standards for network and system management, such as the Simple Network Management Protocol (SNMP) and the Desktop Management Interface (DMI), have been developed to help make management easier. These standards provide an industry-standard way to build instrumentation, and an industry-standard way to interface into the instrumentation. SNMP is used to access Management Information Bases (MIBs), and DMI is used to access Management Information Formats (MIFs). Standard MIBs and MIFs define the metrics that can be provided by any vendor. The information provided is generally referred to as instrumentation. Private MIBs and MIFs pro vide vendor-specific instrumentation. This section looks at some of the disk instrumentation available through each of these standards. Many tools already exist for accessing instrumentation. Several vendors offer browsers and monitoring capabilities that use a common interface to access instrumented objects from different hardware platforms and operating systems. For example, each of the common enterprise management frameworks, including HP OpenView Network Node Manager, HP OpenView IT/Operations, and CA Unicenter TNG, provide a MIB Browser tool to access MIB data. An example is shown in Figure 5-1. Toolkits exist to provide an interface so that developers can write their own tools to monitor or track this information. Toolkits also exist for doing custom instrumentation. Figure 5-1. Using the MIB Browser in OpenView IT/O to access disk- related information. Both standards provide disk-type information and more information is being instrumented as time goes on. Simple Network Management ProtocolA MIB is a standard way of representing information of a certain category. For example, MIB-II provides useful information about a system, such as the number of active TCP connections, system hardware and version information, and so forth. OpenView IT/O, discussed later in this chapter, provides a MIB Browser that helps you to discover which MIBs are available and to see the information being provided by each MIB. The MIB Browser tool can check the value of anything contained in a MIB. If you find a MIB that contains some useful fields, you can use the MIB Browser to gather that data from the target system. The resulting data is displayed in the MIB Browser's output window. By browsing through available MIBs, and by querying values of selected MIB fields, you can gather specific information needed to monitor systems and troubleshoot problems. The SNMP interface provides access to objects stored in various MIBs. On HP-UX systems, the HP-UNIX MIB defines various metrics for monitoring disk resources, such as filesystem usage. Other vendors, such as Sun, have vendor-specific MIBs that provide similar information. Complete MIB definitions are listed in Appendix A, "Using Standards." Objects in the File System Table of the HP-UNIX MIB can be monitored to detect when filesystem usage reaches a certain threshold, so that you can avoid filesystem faults, such as running out of space. Here is a list of the objects available for each entry in the File System Table:
Note that a table entry exists for each mounted filesystem. Desktop Management InterfaceDMI instrumentation is provided for the HP-UX MIF, also known as the System MIF. For monitoring disks, DMI instrumentation is provided for disk hardware devices, as well as for configuration, status, and events. Filesystem resource information is also available in the System MIF. The DMI-instrumented, disk-related metrics are listed next . The complete System MIF and Software MIF definitions are in Appendix A. The Host Storage Table contains information about logical storage areas. It is good for monitoring disk usage and allocation failure events. It contains the following fields:
The Host Devices Table contains information about the hardware devices on a system. It is good for monitoring hardware configuration and faults. It contains the following fields:
Events can also be generated for the status change of a device, initialization failure, and configuration errors for devices in the Host Devices Table. The events contain an assigned severity such as Information, OK, or Critical. The Host Disk Storage Table contains storage information for devices in the Host Devices Table. It contains the following fields:
The File System Table contains the following fields:
Many vendors are developing more DMI instrumentation for disk resources, as well as device-specific information. |
| I l @ ve RuBoard |
EAN: 2147483647
Pages: 90
