CONTROL CHARTS BASED ON WEIGHTED AVERAGE
CONTROL CHARTS BASED ON WEIGHTED AVERAGE
We already have talked about the X and MR chart. In this section, however, we will address the notion of moving the average for the X as well.
The moving-average control chart is more effective than the usual Xbar chart in detecting small process shifts. This is because the chart is a weighted approach and is based on a time period that is predefined by the experimenter. Using both the moving-average and Xbar control charts simultaneously can also yield good results. If they are used simultaneously , the process is considered to be out of control if M t , Xbar t , or both plot outside their respective control limits. It is also helpful to plot the points of M t on a standard Xbar chart, so that a single chart could be used to record the data.
Moving-average control charts may be used in cases in which each sample consists of a single observation or multiple observations.
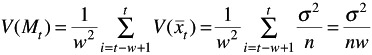
Suppose that samples of size n have been collected. Let [ ![]() ; that is, at time period t, the oldest sample mean is dropped and the newest one is added to the set (this is the same approach that we use for the MR chart). The variance of the moving average M t is as follows :
; that is, at time period t, the oldest sample mean is dropped and the newest one is added to the set (this is the same approach that we use for the MR chart). The variance of the moving average M t is as follows :
Therefore, if ![]() denotes the center line of the control chart, then the 3-sigma control limits for M t are as follows:
denotes the center line of the control chart, then the 3-sigma control limits for M t are as follows:
and
The interpretation of this particular chart is the same as the other ones. However, the reader should remember that, in general, the magnitude of the shift of interest and w are inversely related . Smaller shifts should be guarded against more effectively by longer moving averages.
EAN: 2147483647
Pages: 181