THE GEOMETRIC MOVING AVERAGE (GMA) CONTROL CHART
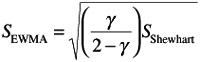
The idea of a weighted average is based on the notion that the weights that are associated with the means decrease geometrically with the age of the sample mean. The concept of GMA was introduced by Roberts (1959), who presented a control chart based on this very notion. Fundamentally, the GMA function is as follows :
where 0 < r ‰ 1 is a constant and the starting value (required with the first sample at t = 1) is z = ![]() . Generally, because the weights appear to decline exponentially when connected by a smooth curve, the GMA z t is sometimes called an exponentially weighted moving average (EWMA). The GMA and the EWMA are used extensively in time series modeling and in forecasting. For a more in-depth discussion, see Box and Jenkins (1976) and Montgomery and Johnson (1976). For general information, see also Champ and Woodall (1987), Ng and Case (1989), Palm (1990), and Wheeler (1995).
. Generally, because the weights appear to decline exponentially when connected by a smooth curve, the GMA z t is sometimes called an exponentially weighted moving average (EWMA). The GMA and the EWMA are used extensively in time series modeling and in forecasting. For a more in-depth discussion, see Box and Jenkins (1976) and Montgomery and Johnson (1976). For general information, see also Champ and Woodall (1987), Ng and Case (1989), Palm (1990), and Wheeler (1995).
If the individual Xbars are independent random variables with variance ƒ 2 /n , then the variance of z t is as follows:
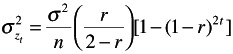
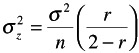
As t increases , ![]() increases to a limiting value, as follows:
increases to a limiting value, as follows:
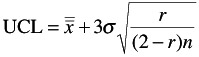
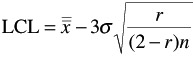
Therefore, the control limits are as follows:
The GMA is much more effective than the moving average control chart for detecting small process shifts. If it is important to recognize small shifts early in the process, then the values of r should be small. The reader should also notice that if r = 1, the GMA control chart reduces itself to the usual Shewhart xbar chart.
Like the Cusum chart, the EWMA chart is not as extensively used as the Xbar, R, or X, MR (Shewhart) charts . The EWMA chart seeks a compromise between the Cusum and Shewhart types. In the Cusum chart, it can be understood from the method of calculation that each cumulative sum value is built up from all previous data points, giving equal weight to each value. By contrast, the X, MR chart, for example, uses only the last point recorded to judge whether the process is within or beyond 3 standard deviations from the mean. (Of course, if the principles or runs analyses are used to interpret the X, MR chart, more than one data point can be taken into account.)
The EWMA chart seeks to give most weight to the most recent data point and progressively less to each chronologically earlier data point.
Control limits for the EWMA chart can be estimated from the Shewhart standard deviation (obtained using the X, MR calculation procedure), according to the following:
It will be convenient to use the same working time data employed for the Cusum chart example. The data and calculations are shown on Table 10.3.
| EWMA Calculations ( » = 0.5) | |||
|---|---|---|---|
| X | ˆ | & pound ; ˆ | |
| 1. | 65 | 5 | (60) |
| 2. | 63 | 0.5 | 62.5 |
| 3. | 63 | 0.3 | 62.7 |
| 4. | 62 | -0.8 | 62.8 |
| 5. | 65 | 2.6 | 62.4 |
| 6. | 61 | -2.7 | 63.7 |
| 7. | 63 | -1.1 | 61.9 |
| 8. | 67 | 5.6 | 61.4 |
| 9. | 62 | -2.2 | 64.2 |
| 10. | 59 | -4.1 | 63.1 |
| 11. | 57 | -4.0 | 61.0 |
| 12. | 55 | -4.0 | 59.0 |
| 13. | 52 | -5.0 | 57.0 |
| 14. | 53 | -1.5 | 54.5 |
| 15. | 51 | -2.8 | 53.8 |
| 16. | 45 | -7.4 | 52.4 |
| 17. | 44 | -4.7 | 48.7 |
| 18. | 48 | 2.1 | 45.9 |
| 19. | 59 | 12.1 | 46.9 |
| 20. | 55 | 2.1 | 52.9 |
| 21. | 54 |
| 54.0 |
| 22. | 57 | 3.0 | 54.0 |
| 23. | 55 | -0.5 | 55.5 |
| 24. | 59 | 3.7 | 55.3 |
| 25. | 57 | -0.1 | 57.1 |
| 26. | 53 | -4.0 | 57.0 |
| 27. | 50 | -5.0 | 55.0 |
| 28. | 47 | -5.5 | 52.5 |
| 29. | 55 | 5.2 | 49.8 |
| 30. | 54 | 1.6 | 52.4 |
| 31. | 61 | 7.8 | 53.2 |
| 32. | 61 | 3.9 | 57.1 |
| 33. | 59 |
| 59.0 |
| 34. | 66 | 7.0 | 59.0 |
| Starting EWMA = (60) | |||
|---|---|---|---|
| X | ˆ | ˆ | |
| 35. | 68 | 5.5 | 62.5 |
| 36. | 65 | -0.2 | 65.2 |
| 37. | 67 | 1.9 | 65.1 |
| 38. | 62 | -4.0 | 66.0 |
| 39. | 61 | -3.0 | 64.0 |
| 40. | 62 | -0.5 | 62.5 |
| 41. | 63 | 0.7 | 62.3 |
| 42. | 61 | 1.6 | 62.6 |
| 43. | 59 | -4.4 | 63.4 |
| 44. | 57 | -4.2 | 61.2 |
| 45. | 60 | 0.9 | 59.1 |
| 46. | 60 | 0.5 | 59.5 |
| 47. | 64 | 4.3 | 59.7 |
| 48. | 62 | 0.4 | 62.4 |
| 49. | 60 | -2.2 | 62.2 |
| 50. | 62 | 0.9 | 61.1 |
| 51. | 64 | 2.5 | 61.5 |
| 52. | 64 | 0.8 | 63.2 |
| 53. | 75 | 11.4 | 63.6 |
| 54. | 59 | -10.3 | 69.3 |
| 55. | 55 | -9.2 | 64.2 |
| 56. | 52 | -7.6 | 59.6 |
| 57. | 50 | -5.8 | 55.8 |
| 58. | 57 | 4.1 | 52.9 |
| 59. | 55 |
| 55.0 |
| 60. | 72 | 17 | 55.0 |
| 61. | 74 | 10.5 | 63.5 |
| 62. | 72 | 3.3 | 68.8 |
| 63. | 62 | -8.5 | 40.5 |
| 64. | 64 | -2.3 | 66.3 |
| 65. | 70 | 5.3 | 64.7 |
| 66. | 66 | 4.0 | 62.0 |
| 67. | 69 | 5.0 | 64.0 |
| 68. | 59 | -7.5 | 66.5 |
The EWMA results are analyzed and the chart is shown in Figure 10.18.
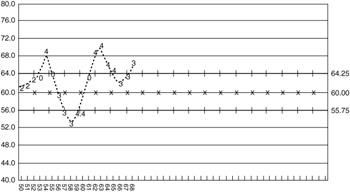
Figure 10.18: Exponentially weighted moving average chart ”working time.
The Shewhart standard deviation by the X, MR method calculates to 2.45. With a chosen value of 0.5 for » the EWMA standard deviation then becomes the following:
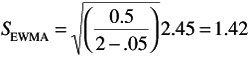
The average EWMA is 59.6 (say, 60) and the ±3S control limits are as follows:
60 + 3 ± — 1.42 = 64.3 and 60 - 3 1.42 = 55.74
EAN: 2147483647
Pages: 181