MISCELLANEOUS CONTROL CHARTS
MISCELLANEOUS CONTROL CHARTS
PRE-CONTROL
PRE-control is a technique that is used to detect shifts or upsets in the process that may result in the production of nonconforming units. The technique differs from statistical process control in that conventional control charts are designed to detect shifts in process parameters that are statistically significant, and PRE-control requires no plotting of graphs and no computations . PRE-control uses the normal distribution in determining changes in the process mean or standard deviation that could result in increased production of nonconforming units. Only three units are required to give control information.
To demonstrate the procedure mathematically, suppose that the quality characteristic is normally distributed and that the natural tolerance limits ( ¼ ± 3 ƒ ) exactly coincide with the specification limits. Furthermore, the process average ¼ is halfway between the specifications, so that the process is producing 0.27% fallout. We construct two PRE-control limits (called upper and lower PC lines), each one fourth of the distance in from the modified limit, as in Figure 10.19. Because the distribution of the quality characteristic is normal, approximately 86% of the process output will lie inside the PC lines, and approximately 7% will lie in each of the regions between the PC line and specification limit. This means that only about 1 item in 14 will fall outside a PC line if the process mean and standard deviation are on the target values.
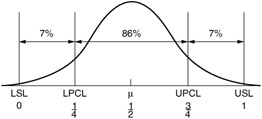
Figure 10.19: Location of PRE-control limit.
If the probability is 1/14 that one unit falls outside a PC line, the probability that two consecutive units fall outside a PC line is (1/14)(1/14) = 1/196. This means that for two consecutive points to fall outside the PC lines, the probability is only 1/196 (very small). If it happens, then there is a shift in the process ( out-of-control condition). If one point is on one side of the PC and the second consecutive point is on the other, then we suspect that the process variability has increased.
Some guidelines to use with PRE-control, assuming 1 to 3% nonconforming production is acceptable and a process capability of at least 1.15, are as follows :
-
Start the process. If the first item is outside specifications, reset and start again.
-
If an item is inside specifications but outside a PC line, check the next item.
-
If the second item is outside the same PC line, reset the process.
-
If the second item is inside the PC line, continue. Process is reset only when two consecutive items are outside a given PC line.
-
If one item is outside a PC line and the next item is outside the other PC line, the process variability is out of control.
-
When five consecutive units are inside the PC lines, shift to frequency gaging.
-
When frequency gaging, do not adjust process until an item exceeds a PC line. Then examine the next consecutive item, and proceed as in Step 4.
-
When process is reset, five consecutive items must fall inside the PC line before frequency gaging can be resumed.
-
If the operator samples from the process more than 25 times without having to reset the process, reduce the gaging frequency so that more units are manufactured between samples. If we must reset before 25 samples are taken, increase the gaging frequency. An average of 25 samples to a reset indicates that the sampling frequency is satisfactory.
To demonstrate the procedure pictorially, we modify the normal control chart in the sense that we split the control chart into standard deviation zones. Zone C is colored green, indicating acceptable performance. Zone B is colored yellow, indicating caution; and Zone A is colored red, to indicate problems with the process.
PRE-control is an example of a technique called narrow-limit gaging (or compressed-limit gaging), in which inspection procedures are determined using tightened limits located so as to meet established risks of accepting nonconforming product. Narrow-limit gaging is discussed in more general terms by Ott (1975) and Montgomery (1985).
Although PRE-control has the advantage of simplicity, it should not be used indiscriminately. The procedure has several serious drawbacks. First, because no control chart is usually constructed , all the sensitizing rules and pattern recognition procedures associated with the control chart cannot be used. Therefore, none of the out-of-control conditions covered in this chapter apply. Second, the small sample sizes greatly reduce the ability of the procedure to detect even moderate-to-large shifts. Third, PRE-control does not provide information that is helpful in bringing the process into control, or that would be helpful in reducing variability.
Finally, the assumption of an in-control process and adequate process capability is extremely important. PRE-control would be most effectively used in manufacturing processes in which the process-capability ratio is much greater than 1 (perhaps at least 2 or 3), and in which a near-zero defects environment has been achieved.
EAN: 2147483647
Pages: 181