SHORT-RUN VARIABLE CHARTS
SHORT-RUN VARIABLE CHARTS
To resolve all the problems of variability and the calculating issues of control limits, several control charts have been developed for short production runs. The applications and selection decision for each of the charts are fundamentally exactly as those for the traditional charts. In other words, they are divided into the variable and attribute categories. So, depending on the data on hand, one would use the variable charts or the attribute charts.
NOMINAL XBAR AND R
Description. This method allows all part numbers run on a given process to be plotted on the same chart for the purpose of determining statistical control. This is made possible by first coding the actual measured readings as a deviation from a common reference point, in this case, the nominal print specification. Then the average and range of these coded data are calculated and plotted on the nominal Xbar and R chart.
When the next scheduled part number is run, the nominal value for that part number is used to code the data in the same manner as for the first part number. By doing this, the zero point on the nominal Xbar control chart scale represents the nominal value for all coded data, no matter which part number is being run.
Subgroup Size . This should be two to five, usually three. In long-run situations, traditional Xbar and R charts commonly use subgroup sizes of four or five. Because of the small lot sizes and shorter running times associated with short runs, it is important to understand what is happening in the process before most of the run is over. Thus, smaller subgroup sizes (such as two or three) are used for the short-run SPC charts.
Plot Points. The range plot point is calculated in the same manner as for traditional range charts ”the highest measurement in the subgroup minus the lowest .
R = X high - X low
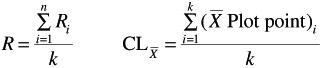
There are two ways for calculating the Xbar plot points ”the long method and the short-cut method. For a subgroup size of n = 3 with X representing the measurement of the i th piece), the calculation methods are as follows :
| Long Method | Short-Cut Method |
|---|---|
| | |
| | |

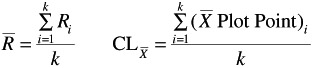
Center Lines (CL). The center lines for the nominal range chart and the nominal Xbar chart are calculated with these formulas, using the range and Xbar plot points from all part numbers run on this process ( k is the number of plot points summed and should be at least 20):
Control Limits. Use the following formulas to calculate the control limits (the control limit factors D 3 , D 4 , and A 2 can be found in Table 13.1):
After the center lines and control limits are drawn on the nominal Xbar and R chart, it can be interpreted in almost the same manner as a traditional Xbar and R chart (see Chapter 11).
Assumptions. The nominal Xbar and R chart allows the computation one set of control limits for all part numbers because it assumes that the process variation (Rbar) of all part numbers is approximately equal. This is usually true if the five Ms (manpower, machine, material, measurement, method) are similar for all part numbers run on the process.
If the process variation of one part number is more than 30% larger than the others, it cannot be plotted on the same nominal Xbar, R chart. Because the control limits are dependent on Rbar, this part number would require significantly wider control limits than the others. If this happens, this part number must be plotted on its own separate chart, reducing its variation so that it is similar to the others or using some other short-run technique that does not include this assumption.
To maintain constant control limits, the subgroup size ( n ) must also be constant for all subgroups of all part numbers because the control limit factors D 3 , D 4 , and A 2 are functions of n.
The nominal print specification must be best for the average output of all part numbers run on the chart because this chart forces the operator to center the process output at the nominal value of the part number being run.
TARGET XBAR AND R
Description. The target Xbar and R chart is a slight variation on the nominal Xbar and R chart in which the assumption of nominal is best for all part numbers is relaxed . A target Xdouble bar value is used in place of the nominal to code the subgroup data.
In the majority of manufacturing operations, nominal is best for the average of the process output, but there are at least three exceptions.
-
Nominal is not defined because there is a unilateral specification (either an LSL or USL, but not both). The engineering requirement for weld strength is a minimum of 1,000 lb with no maximum. In this case, the nominal does not exist, and a different target value for the process output average must be determined. Even if a nominal did exist, it would not be best because higher weld strength is the goal.
-
The dimension of the characteristic being charted changes once it leaves this operation. The outer diameter of a metal shaft is ground before heat treating. Heat treating causes the outer diameter to grow. The grinding operation must use a target Xdouble bar value that is somewhat less than nominal if the shaft is to end up at nominal after heat treating . Another example from the plastics industry may prove the point even further. Several hours after a plastic part is injection molded, it will cool and shrink. Because parts coming off this operation are immediately measured, a target Xdouble bar value greater than that of the nominal must be used to code the data.
-
The process average cannot easily be moved to nominal because the process is "nonadjustable." It is unfair to require an operator to center the process output at nominal if the operator is physically unable to adjust the equipment to that value. A target Xdouble bar value reflecting this should be used in the short term until the process can be altered to run at nominal.
In all these cases, the target Xdouble bar (not the nominal) is "best" for the average of the process output and should be used to code all subgroup data. The results are then plotted on the target Xbar and R chart. Of special interest is the fact that for most part numbers, the target Xdouble bar value will be the nominal.
Subgroup Size. This should be two to five, usually three.
Plot Points. The range plot point is calculated in the same manner as is done for the range chart: the highest measurement in the subgroup minus the lowest.
R = X high - X low
Because it is so much easier, only the short-cut method for calculating the Xbar plot points is shown:
Center Lines (CL). The center lines for the target range chart and the target Xbar chart are as follows:
when calculated with these formulas, using the range and Xbar plot points from all part numbers run on this process ( k should be at least 20).
Control Limits. Use these formulas to calculate the control limits, which are independent of Xdouble bar. The control limit factors D 3 , D 4 , and A 2 can be found in Table 13.1.
After the center lines and control limits are drawn on the target Xbar and R chart, it can be interpreted in almost the same manner as the nominal Xbar and R chart.
Assumptions. The target Xbar and R chart assumes that the process variations (Rbar) of all part numbers run on the process are approximately equal. If the process variation of one part number is more than 30% larger than the others, it cannot be plotted on the same target Xbar and R chart because the control limits would be significantly wider for this part number than the others.
To maintain constant control limits, the subgroup size ( n ) must also be constant for all subgroups of all part numbers because the control limit factors are a function of n.
SHORT-RUN XBAR AND R
Description. Both the nominal and target charts assume that the process output variation (Rbar) of all part numbers charted is similar, but in most manufacturing processes, this is usually not true because of changes in material, tooling, fixturing, or any of the other five Ms. If the average range changes from part number to part number, then so do the control limits for the nominal and target charts because they are a function of Rbar.
The coding methods used for these charts adjusted the data from different part numbers only for differences in where the process output should be centered. Part numbers with different Rbar values would have to be plotted on separate charts.
The coding method used for the short-run Xbar and R chart adjusts the data for differences in both centering and variation. This is accomplished through the use of both a target Xdouble bar and a target Rbar value. The resulting control limits are independent of both Xdouble bar and Rbar.
Subgroup Size. This is two to five, usually three.
Plot Points. As you might expect, the coding formulas for this chart are slightly different. Both the range and average values calculated from a subgroup have to be coded.
R Plot Point = R /Target Rbar
Center Lines (CL). With this method of coding for the subgroup ranges, the result can be plotted on the short-run range chart with a center line of 1. The center line of the short-run Xbar chart is 0. Because these are constant values, they can be drawn on the chart before any subgroup data are collected.
Control Limits. This special coding method results in control limits for the plot points that are independent of both Xdouble bar and Rbar. Now part numbers having significantly different output averages, and variation can be plotted on the same chart. Notice that the limits are constants and do not need to be calculated. This means that they can be drawn on the chart before any data are collected. When the plot points of the first subgroup are charted, it will be clear immediately whether the process is in or out of control.
Assumptions. There is only one major assumption left ”that the subgroup size for all subgroups of all part numbers run on the process must be constant. This is because the control limits for the short-run Xbar and R chart are just the control limit factors, which are a function of the subgroup size.
SHORT-RUN XBAR AND S
Description. Many companies that have automated their control charts prefer to use an s chart instead of the R chart ( "s" is for sample standard deviation). Both the subgroup statistics s and R measure within-subgroup variation. s is a better measure because it uses all the data in a subgroup, but R is typically used because it is much easier for the operator to calculate.
If the calculations are automated, then the argument for using R is no longer valid. If your company has decided to change to s charts and has short production runs, it can use the short-run Xbar and S chart.
Subgroup Size. This must be more than two (so s can be calculated), usually set at three.
Plot Points. The coding formulas for this chart are derived in a manner similar to those for the short-run Xbar and R chart. Both the s and Xbar values calculated from a subgroup have to be coded. The target values for this chart are found by using one of the four methods used for the short-run Xbar and R chart.
Center Lines (CL). These coded plot points go on the short-run S chart (center line is 1) and the short-run Xbar chart (center line is 0). These constant values can be drawn on the chart before any subgroup data are collected.
Control Limits. This special coding method results in control limits for the plot points that are constant and independent of both Xdouble bar and Sbar. So now part numbers with significantly different output averages and variation can be plotted on the same chart.
The control limit factors B 3 , B 4 , and A 3 can be found in Table 13.1.
Assumptions. There are two assumptions: the subgroup size for all part numbers run on the process must be constant, and it must be greater than 2.
STANDARDIZED XBAR AND S
Description. The only restriction on the short-run Xbar, R (or s) chart is that the subgroup sizes for each part number must be identical. If this is not possible in some situation (for instance, a larger subgroup size is used to check the initial setup than during the run), then the standardized Xbar and s chart, which does not have this requirement, should be used.
Subgroup Size. This must be greater than two; usually is three.
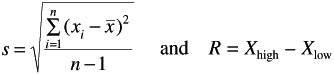
Plot Points. The calculations involved for these plot points are quite cumbersome and lengthy. If this chart is used for any length of time, these calculations should be automated.
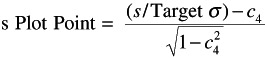
The c 4 value will vary from plot point to plot point as the subgroup size n changes (the c 4 values are listed in Table 13.1). The target sigma and Xdouble bar remain the same for all subgroup sizes of a given part number.
Center Lines (CL). These coded plot points go on the standardized s chart (center line is 0) and the standardized Xbar chart (center line is 0). These constant center line values can be drawn on the chart before any subgroup data are collected.
Control Limits. This special coding method (similar to calculating Z scores) results in control limits for the plot points that are constant and independent of Xdouble bar, sbar, and subgroup size. These standardized limits of ±3 represent the ±3 ƒ limits of a traditional control chart.
Assumptions. There is only one minor assumption that the subgroup size is at least 2 in all subgroups so that the sample standard deviation can be calculated. The lack of assumptions means that this is a powerful chart because it can be applied in almost any situation. The trade-off is the difficulty of the plot point calculations.
NOMINAL X AND MR
Description. Only one part number can be plotted on the traditional individual and moving-range chart, but in most short-run situations, multiple part numbers are run over the process. Just as was done with the traditional Xbar and R chart, the traditional X and MR chart can be modified to allow different part numbers to be plotted on it. This is accomplished by coding the measurements before they are plotted. The coding method of the nominal X and MR chart (subtract the nominal from the piece measurement) is the easiest of any short-run chart but has the greatest number of assumptions.
Subgroup Size. For short runs, the X plot point is based on one measurement; the moving range is calculated from two consecutive X plot points.
Plot Points. First, the X plot point is calculated by subtracting the nominal value from the individual piece measurement. Then the MR plot point is calculated by taking the absolute value of the difference between two consecutive X plot points.
X Plot Point = X i - nominal; MR Plot Point = (X plot point) - (X plot point) i-1
The vertical lines in the MR formula mean that one takes the absolute value of the difference between the plot points, the current ( i ) and the immediately previous one ( i - 1). (This means that the result is always a positive number. If it is not, something is wrong somewhere.)
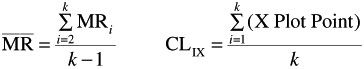
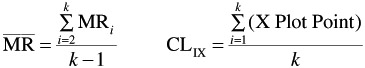
Center Lines (CL). The X and MR plot points from all part numbers are used to calculate the center lines. Because there is no MR for the first measurement recorded, the sum of the moving ranges is divided by k - 1 rather than k. The number of measurements ( k ) used to calculate the center lines should be at least 20.
Control Limits. The control limit factor D 3 is 0, and D 4 is 3.27 (remember, the subgroup size for the moving range is two). The A 2 (or E 2 ) factor is 2.66 for this chart.
| UCL MR = 3.27 MRbar | UCL IX = CL X + 2.66 MRbar |
| LCL MR = 0 | LCL IX = CL X - 2.66 MRbar |
Assumptions. The control limits for this chart assume that the process output has a normal distribution. Check this assumption either by plotting the measurements in a histogram using normal probability paper or by conducting a statistical goodness-of-fit test (see Chapter 5).
In addition, nominal must be best for all part numbers, and the variation of all part numbers must be similar (within 30%) because the limits depend on the average MR.
TARGET X AND MR
Description. If nominal is not best for all part numbers, the nominal X and MR chart cannot be used. However, it can be modified to relax this assumption by using a target Xdouble bar value instead of the nominal to code the measurements.
Subgroup Size. For short runs, the X plot point is based on one measurement; the moving-range value is based on the difference between two consecutive X plot points.
Plot Points. The target Xdouble bar value for the part number being run is first subtracted from the measurement to determine the X plot point. The moving range plot point is then calculated in the same manner as for the nominal MR chart.
X Plot Point = ( X i - Target Xbar)/Target Rbar MR Plot Point = (X Plot Point) i - (X Plot Point) i -1
The vertical lines in the MR formula indicate the absolute value of the difference between two consecutive plot points.
Center Lines (CL). Because there is no MR for the first measurement, the sum of the moving ranges is divided by k - 1 rather than k. The number of measurements ( k ) used to calculate the center lines should be at least 20.
Control Limits. The control limit factor D 3 is 0 and D, 4 is 3.27 (remember, the subgroup size for the moving range is 2). The A 2 (or E 2 ) factor is 2.66.
| UCL MR = 3.27 MR | UCL IX = CL IX + 2.66 MR |
| LCL MR = 0 | LCL IX = CL X - 2.66 MR |
Assumptions. The control limits for this chart assume that the process output has a normal distribution. Check this assumption either by plotting the measurements in a histogram, using normal probability paper, or by conducting a statistical goodness-of-fit test.
In addition, the variation of all part numbers must be similar (within 30%) because the control limits are still a function of Rbar.
SHORT-RUN X AND MR
Description. Only part numbers with similar Rbar values can be plotted on the target X and MR chart, but in many short-run situations, part numbers have significantly different amounts of variation. The target X and MR chart can be modified to handle this situation by coding the piece measurements not only for differences in centering (subtracting target Xdouble bar) but for differences in variation as well (dividing by target Rbar). The result of this modification is called the short-run X and MR chart.
Subgroup Size. For short runs, the X plot point is based on one measurement; the moving range value is calculated from the difference between two consecutive X plot points.
Plot Points. First, the X plot point is coded in a manner similar to the short-run Xbar plot point. Then the moving range plot point is calculated as done for the target MR chart.
X Plot Point = ( X i - Target Xbar)/Target Rbar
MR Plot Point = (X Plot Point) i - (X Plot Point) i -1
Note that the MR plot point is not divided by target Rbar because the X plot points used in its calculation have already been coded.
Center Lines (CL). Just as with the short-run Xbar and R chart, the center line of the short-run MR chart is 1, and the center line of the short-run X chart is 0. These constant values can be drawn on the chart before any measurements are taken.
CL MR = 1 CL X = 0
Control Limits. This special coding method results in control limits for the plot points that are constant and independent of both Xdouble bar and Rbar. The control limit factor D 3 is 0, and D 4 is 3.27 (remember, the subgroup size for the moving range is 2). The A 2 (or E 2 ) factor is 2.66.
| UCL MR = 3.27 | UCL IX = + 2.66 |
| LCL MR = 0 | LCL IX = - 2.66 |
Assumptions. The only major assumption left, which is common for all X charts, is that the process output must be normally distributed. Check this assumption either by plotting the measurements in a histogram, using normal probability paper, or by conducting a statistical goodness-of-fit test.
NOMINAL MA AND MR
Description. If a subgroup size of one is desired but the process output is nonnormally distributed, a variation of the X and MR chart can be used. This modification is called the moving average and moving range (MA and MR) chart.
The central limit theorem states that subgroup averages taken from any process (no matter whether the output is normally distributed or not) tend to have a normal distribution. On the MA chart, two consecutive measurements are first averaged, then plotted. This average tends to be normally distributed even if the individual measurements come from a nonnormal distribution. Because averages are now being plotted, the MA chart is also more sensitive than the X chart to changes in the overall process average.
If the nominal value is subtracted from the measurements before they are averaged, this becomes the nominal MA and MR chart. There is more work involved in performing the calculations associated with this chart, but the normality assumption is relaxed.
Subgroup Size. For short runs, the moving average and the moving range values are calculated from two consecutive X plot points.
Plot Points. The appropriate nominal value is first subtracted from each measurement to calculate the X plot point. Then the MR plot point is calculated by taking the absolute value of the difference between two consecutive X plot points. For the MA plot point, the two consecutive IX plot points are averaged. No plot points ( neither MR nor MA) can be calculated for the first measurement.
X Plot Point = X i - Nominal MR Plot Point = (X Plot Point) i - (X Plot Point) i -1
MA Plot Point = [(X Plot Point) i + (X Plot Point) i- 1 ]/2
Center Lines (CL). Because there is no MR for the first measurement, the sum of the moving ranges is divided by k - 1 ( k ‰ 20). The center line for the moving averages is the average of the deviations of the individual measurements from their nominal value.
Control Limits. The control limit factor D 3 is 0, and D 4 is 3.27. The A 2 (or E 2 ) factor is 1.88 (remember, the subgroup size for the moving average is two).
| UCL MR = 3.27 MR | UCL MA = CL MA + 1.88 MR |
| LCL MR = 0 | LCL MA = CL MA - 1.88 MR |
Assumptions. Nominal must be best for all part numbers, and the variation of all part numbers must be similar (within 30%).
TARGET MA AND MR
Description. If nominal is not best for all part numbers, the nominal MA and MR chart cannot be used. However, this chart can be modified to eliminate this assumption by using a target Xdouble bar value instead of the nominal to code the measurements. These coded measurements can be plotted on the target MA and MR chart. For most part numbers, the target Xdouble bar value is the nominal.
Subgroup Size. For short runs, the moving average and the moving range plot points are calculated from two consecutive X plot points.
Plot Points. Target Xdouble bar is subtracted from a measurement to give the X plot point. The MR plot point is calculated by taking the absolute value of the difference between two consecutive X plot points. For the MA plot point, the two consecutive X plot points are averaged.
X Plot Point = X i - Target X MR Plot Point = (X Plot Point) i - (X Plot Point) i -1
The vertical lines in the MR formula mean that the absolute value of the difference is taken. There are no plot points (neither MR nor MA) for the first measurement.
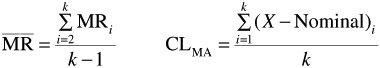
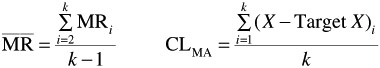
Center Lines (CL). Because the MR plot point cannot be calculated for the first measurement, the sum of the moving ranges is divided by k - 1 ( k should be at least 20). The center line for the moving averages is the average of the deviations of the individual measurements from their target value.
Control Limits. The control limit factor D 3 is 0, and D 4 is 3.27. The A 2 (or E 2 ) factor is 1.88 (remember, the subgroup size for the moving average is two).
| UCL MR = 3.27 MRbar | UCL MA = CL MA + 1.88 MRbar |
| LCL MR = 0 | LCL MA = CL MA - 1.88 MRbar |
Assumptions. The variation of all part numbers must be similar (within 30%).
SHORT-RUN MA AND MR
Description. Only part numbers with similar Rbar values can be plotted on the target MA and MR chart, but in many short-run situations part numbers have significantly different amounts of variation. By coding the measurements for differences in variation as well as centering, the target MA and MR chart can be turned into the short-run MA and MR chart.
Subgroup Size. For short runs, the moving average and moving range plot points are calculated from 2 consecutive X plot points.
Plot Points. The individual measurements are first coded as done for the short-run X chart (first subtract target Xdouble bar, then divide by target Rbar). The MR plot point is calculated in the same manner as done for the target MR chart. The two consecutive X plot points are averaged to calculate the MA plot point.
X Plot Point = ( X i - Target Xbar)/Target Rbar
MR Plot Point = (X Plot Point) i - (X Plot Point) i -1
Note that the MR plot point is not divided by target Rbar because that was already done when the X plot point was calculated.
Center Lines (CL). Just as with the short-run Xbar and R chart, the centerline of the short-run MR chart is 1, and the center line of the short-run IX chart is 0. These are constant values that can be drawn on the chart before any data collection.
CL MR = 1 CL MA = 0
Control Limits. This special coding method results in control limits for the plot points that are constant and independent of both Xdouble bar and Rbar. They can be drawn on the chart before any data collection. The control limit factor D 3 is 0, and D 4 is 3.27. The A 2 (or E 2 ) factor is 1.88 ( n = 2 for the moving averages).
| UCL MR = 3.27 | UCL MA = CL MA + 1.88 |
| LCL MR = 0 | LCL MA = CL MA - 1.88 |
Assumptions. None.
EAN: 2147483647
Pages: 181