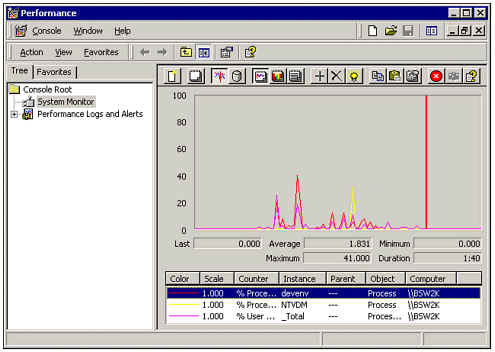
| In the last section, we discussed a way to measure the execution time of program functions. However, when optimizing the program there may be other factors that determine your optimization steps. For example, it is also helpful to know which functions are executed most frequently. Suppose you have an application used for data entry. If it takes 10 seconds to initially load the application and sign on, but another 10 seconds every time you press the Save button you definitely should place a higher priority on optimizing the code behind the Save button. Another factor that may impact application performance is the computer on which your program is running. Extra high memory usage or a network bottleneck can wreak havoc on even the most well-written code. To troubleshoot these problems, you first have to know they exist. The Windows operating system provides performance counters, which can be used to examine what is happening on your system. You can keep track of how many times a particular piece of code is executed, as well as track certain system resources such as disk i/o requests. A counter in Windows works just like the speedometer on your car, in that it contains a value that changes in response to some condition of the system. Windows includes a tool called Performance Monitor, pictured in Figure 26.7, which allows you to view system counters in a graphical manner. Figure 26.7. Visual Studio .NET provides classes to read the built-in performance counters or add your own.  Note On Windows 2000, the Performance Monitor is located in the Administrative Tools section of the Control panel.
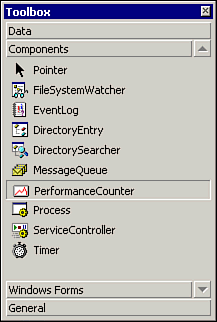
In this section, we'll conclude our discussion of performance and optimization with an exercise that demonstrates how to access Windows Performance information from Visual Basic. We will show how you can add a performance counter to the system, as well as read the values of existing performance counters. Reading from a Performance Counter The easiest way to start working with performance counters in your program is to use the PerformanceCounter control, as shown in Figure 26.8. Figure 26.8. The PerformanceCounter control is located in the Components section of the Toolbox.  To get started with the sample application, perform the following steps: -
Start a new Windows Application in Visual Studio .NET. -
Drag a PerformanceCounter control to the form. -
Drag a Timer and a TextBox control to the form. -
Using the Properties window, set the Interval property of the Timer to 1500. -
Set the Enabled property of the Timer to True. -
Set the CategoryName property of the performance counter to TCP. -
Set the CounterName property of the performance counter to Connections Established. -
Enter the code for the Timer's Tick event from Listing 26.8. Listing 26.8 PERFCOUNTER.ZIP Reading Performance Counter Values Private Sub timer1_Tick(ByVal sender As System.Object,_ ByVal e As System.EventArgs) Handles timer1.Tick TextBox1.Text = PerformanceCounter1.RawValue.ToString End Sub -
Press F5 to run the sample program. The text box will display the current number of TCP network connections to your computer. -
Establish another connection by opening a Web browser or SQL query tool. The text box value should be updated to reflect the new number of network connections.
As you can see, the PerformanceCounter control is an easy way to find out a lot of information about your system related to the processor, memory, and other statistics. In order to select a counter, you have to set three properties: CategoryName A group of related performance counters. For example, the Memory category has counters related to the memory on your machine. CounterName A specific performance measure, such as the number of bytes of available memory. InstanceName An instance of a performance counter. For example, if you are using a machine with four processors, each processor represents a separate instance of processor-related counters. (This property is optional for some counters.)
After you have set up a PerformanceCounter control, you can access the value of the associated counter using the RawValue property. For example, you might want to monitor the available memory or disk space and send an alert to an administrator if the value reaches a certain level. Writing to a Performance Counter In addition to accessing performance counters that already exist on your system, you can add a custom performance counter with just a few lines of code. Once added, this custom performance counter is available in the Windows Performance Monitor for yourself and others to view. The exercise described in the section shows how to create a new category called VBAppCounters, which contains two counters: TestCounter1 and TestCounter2. Creating the Sample Program The System.Diagnostics namespacecontains all the classes for working with performance counters. To create a sample performance counter, perform the following steps: -
Start a new Visual Basic Windows application. -
Drag three Button controls to the form. Set their Name properties to btnAdd, btnSubtract, and btnClear. Set their Text properties to Add, Subtract, and Clear. -
Add the code from Listing 26.9 to your form class. -
Run the program and click the Add button once. This will create the custom performance category and associated counters. -
Open the Windows Control panel. Select Administrative Tools, and then click the Performance icon. -
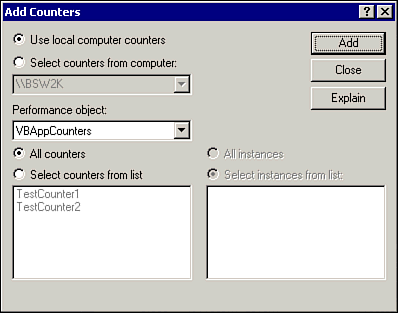
Click the plus (+) icon on the Performance Monitor toolbar, and you should see a screen similar to Figure 26.9. Figure 26.9. You can add your own custom categories to the Windows performance counter.  -
From the Category List select VBAppCounters. You should see TestCounter1 and TestCounter2 appear as available counters. -
Choose the All Counters option. -
Click the Add button and then the Close button to close the dialog box. You should see a red vertical line slowly moving across your screen as the performance monitor samples the test counter values. -
Arrange the Visual Basic form and the Performance Counter window so you can see both on the screen at the same time. -
Rapidlyclick the Add button. Notice the change in the performance counter. (You can also click Subtract to decrease the performance counter or Clear to set its value to 0.)
Listing 26.9 PERFCOUNTER.ZIP Using a Custom Performance Counter Private TestCtr1 As PerformanceCounter Private TestCtr2 As PerformanceCounter Private Sub InitCustomCounters() Dim CCD As CounterCreationDataCollection Dim CNT As CounterCreationData If Not PerformanceCounterCategory.Exists("VBAppCounters") Then CCD = New CounterCreationDataCollection() CNT = New CounterCreationData("TestCounter1", "test.",_ PerformanceCounterType.NumberOfItems32) CCD.Add(CNT) CNT = New CounterCreationData("TestCounter2", "test2.",_ PerformanceCounterType.RateOfCountsPerSecond32) CCD.Add(CNT) PerformanceCounterCategory.Create("VBAppCounters", "Test Category", CCD) End If TestCtr1 = New PerformanceCounter("VBAppCounters", "TestCounter1", False) TestCtr2 = New PerformanceCounter("VBAppCounters", "TestCounter2", False) End Sub Private Sub btnAdd_Click(ByVal sender As System.Object,_ ByVal e As System.EventArgs) Handles btnAdd.Click InitCustomCounters() TestCtr1.Increment() TestCtr2.Increment() End Sub Private Sub btnSubtract_Click(ByVal sender As System.Object,_ ByVal e As System.EventArgs) Handles btnSubtract.Click InitCustomCounters() TestCtr1.Decrement() TestCtr2.Decrement() End Sub Private Sub btnClear_Click(ByVal sender As System.Object,_ ByVal e As System.EventArgs) Handles btnClear.Click InitCustomCounters() TestCtr1.RawValue = 0 TestCtr2.RawValue = 0 End Sub In this exercise we have demonstrated how to create a performance counter and change its value. A performance counter object works just like any other object, in that it can be manipulated through methods and properties. However, keep the following key points in mind when using performance counters: When creating a custom performance counter, you have to create the category and any counters in the category at the same time. The code in Listing 26.9 builds a collection of counters and then creates all the custom counters and their category using the Create method. Different types of counters are available. For example, as you clicked the Add button, you may have noticed the graphs of the two lines were slightly different. The constant RateOfCountsPerSecond32 caused TestCounter2 to measure on a per-second basis. For a complete list of constants and their description, see the help files. When declaring an instance of a PerformanceCounter object whose value you want to change, set the ReadOnly property during initialization of the object. At the time of this writing, setting the ReadOnly property after creating the object instance had no effect.
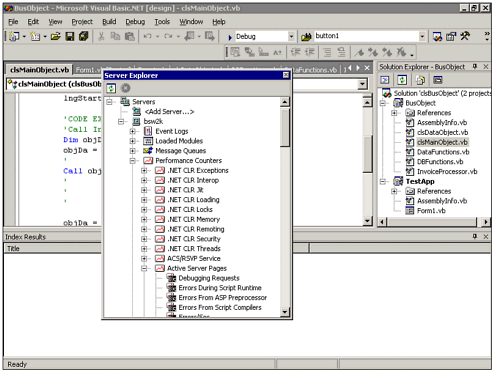
Another point we did not make in the previous exercise is performance counters can be created, accessed, and deleted from within Visual Studio by using the Server Explorer. The list of performance counters as shown in the Server Explorer window is shown in Figure 26.10. Figure 26.10. To delete or create a performance counter, right-click in the Server Explorer window.  Monitoring application performance, particularly for those applications that are heavily used, enables you to tune and optimize critical areas so your users can enjoy increased processing speed. As we have demonstrated, using a custom performance counter is an easy way to take advantage of the Performance Monitor utility provided by Windows 2000. |