7.2 Application tuning
|
| < Day Day Up > |
|
7.1 Tools for monitoring and tuning
DB2 UDB offers several tools that help you monitor and tune your databases and applications. Before you start tuning your system, you must have an idea of what to tune. Monitoring helps find out what is going on in your system; for example, if you have a long running transaction and need to know what the reason is. One method to handle the problem is to try something and see if it helps. The better method is to monitor the system, pinpoint the problem, and resolve the problem.
Monitoring consumes system resources. Therefore, it is a good idea to do it within a test environment, and not in a production system. If you cannot recreate the problem in a test environment or if the production system and the test system are not comparable, then you should start monitoring in production. But use monitoring only as long as needed and switch it off after you finish your tuning.
The database manager parameter MON_HEAP_SZ configures the amount of memory reserved for monitoring within DB2 UDB. The default value is not designed for high monitor activities. Therefore it might be necessary to change the parameter to a higher value if you plan to monitor.
7.1.1 Snapshot monitor
The snapshot monitor gives you the status of your database server for a specific point in time. DB2 UDB offers several monitors that can be turned on or off separately. To view the available monitoring options and the status use the command DB2 GET MONITOR SWITCHES. In Figure 7-1, you can see an example output. By default, the monitor switches are turned off except for the monitor for timestamp information that is turned on by default. If a switch is on, you can see from the output of DB2 GET MONITOR SWITCHES when the monitor was activated or reset.
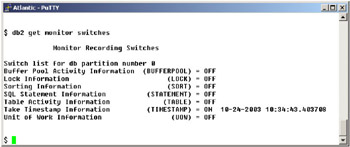
Figure 7-1: Status of monitor switches for snapshot monitoring
| Note | Any switch (except DFT_MON_TIMESTAMP) that is turned ON instructs the database manager to collect monitor data related to that switch. Collecting additional monitor data increases database manager overhead that can impact system performance. Turning the dft_mon_timestamp switch OFF becomes important as CPU utilization approaches 100 percent. |
The values collected from the monitor output will be accumulated from the moment the monitor switch is activated or reset. The time displayed behind an active monitor shows the timestamp for the monitor that was activated. With the reset command this time will not be updated.
To change the status of a monitor, change the switches with the command shown in the Example 7-1.
Example 7-1: Command syntax for UPDATE MONITOR SWITCHES
UPDATE MONITOR SWITCHES USING {switch-name {ON | OFF} ...} [AT DBPARTITIONNUM db-partition-number | GLOBAL] switch-name: BUFFERPOOL, LOCK, SORT, STATEMENT, TABLE, TIMESTAMP, UOW Example 7-2 shows how to turn on the monitor switches that are turned off by default. Any combination is possible with ON or OFF.
Example 7-2: Command to activate snapshot monitoring
-- activates all monitor switches except TIMESTAMP that is on by default UPDATE MONITOR SWITCHES USING BUFFERPOOL ON LOCK ON SORT ON STATEMENT ON TABLE ON UOW ON;
The switches for snapshot monitoring are also part of the database manager configuration. In the Default database monitor switches section of the DB2 GET DBM CFG command output, you can see the startup configuration of the monitor switches. Using the command UPDATE DBM CFG USING ..., you can configure the monitor switches to be active from the startup of the server. You should turn on a switch in the configuration file only if you want to collect data starting from the moment the database manager is started. Otherwise, each monitoring application should set its own switches, and the data collected are relative to the time its switches are set.
In Table 7-1 we show you the monitor switches along with the information they provide. The DBM parameters shown in the table are online configurable. No db2stop and db2start are needed to activate the changes.
| Group | Information provided | Monitor Switch | DBM parameter |
|---|---|---|---|
| Bufferpools | Number of reads and writes from/to bufferpool and disk; time taken | BUFFERPOOL | DFT_MON_BUFPOOL |
| Locks | Number of locks held; number of deadlocks; what is locked and which lock mode is used | LOCK | DFT_MON_LOCK |
| Sorts | Number of heaps used; sort overflows; performance | SORT | DFT_MON_SORT |
| SQL statements | Start and stop time | STATEMENT | DFT_MON_STMT |
| Tables | Rows read; rows written | TABLE | DFT_MON_TABLE |
| Timestamps | Timestamp information | TIMESTAMP | DFT_MON_TIMESTAMP |
| Unit of work | Start and end time; completion status | UOW | DFT_MON_UOW |
To retrieve the collected information use the DB2 GET SNAPSHOT command. This command is very complex. Example 7-3 shows the complete syntax.
Example 7-3: Command syntax for get snapshot
>>-GET SNAPSHOT FOR---------------------------------------------> >--+-+-DATABASE MANAGER-+--WRITE TO FILE -----------+----------> | +-DB MANAGER-------+ | | '-DBM--------------' | +-ALL--+-----+--DATABASES-------------------------+ | '-DCS-' | +-ALL--+-----+--APPLICATIONS----------------------+ | '-DCS-' | +-ALL BUFFERPOOLS---------------------------------+ +-+-----+--APPLICATION--+-APPLID--appl-id------+--+ | '-DCS-' '-AGENTID--appl-handle-' | +-FCM FOR ALL DBPARTITIONNUMS---------------------+ +-LOCKS FOR APPLICATION--+-APPLID--appl-id------+-+ | '-AGENTID--appl-handle-' | +-ALL REMOTE_DATABASES----------------------------+ +-ALL REMOTE_APPLICATIONS-------------------------+ '-+-ALL-------------------+--ON--database-alias---' +-+-----+--+-DATABASE-+-+ | '-DCS-' '-DB-------' | +-+-----+--APPLICATIONS-+ | '-DCS-' | +-TABLES----------------+ +-TABLESPACES-----------+ +-LOCKS-----------------+ +-BUFFERPOOLS-----------+ +-REMOTE_DATABASES------+ +-REMOTE_APPLICATIONS---+ '-DYNAMIC SQL-----------' >--+----------------------------------------+------------------>< +-AT DBPARTITIONNUM--db-partition-number-+ '-GLOBAL---------------------------------'
The information you can receive from the snapshot is very extensive. As you can see from the options, it is possible to take a snapshot from several points of view, starting from a snapshot for the database manager with a global view to a granular snapshot of dynamic SQL statements. The snapshots can also be taken when the monitor switches are switched off. Some information is collected all of the time, and for those are not collected by default, the values are marked with NOT COLLECTED.
In Example 7-4 and Example 7-5 on page 242 we present example output of snapshots to give you a feeling how they look. We show the outputs of a snapshot for the database manager and a database. For more details we recommend using the snapshot monitor and the online documentation.
Example 7-4: Output of a DBM snapshot
Database Manager Snapshot Node name = Node type = Enterprise Server Edition with local and remote clients Instance name = db2inst1 Number of database partitions in DB2 instance = 1 Database manager status = Active Product name = DB2 v8.1.1.24 Service level = s030728 (U488481) Private Sort heap allocated = 0 Private Sort heap high water mark = 277 Post threshold sorts = 0 Piped sorts requested = 4 Piped sorts accepted = 4 Start Database Manager timestamp = 10-24-2003 10:34:43.403708 Last reset timestamp = 11-05-2003 09:35:14.167372 Snapshot timestamp = 11-05-2003 13:16:11.390812 Remote connections to db manager = 4 Remote connections executing in db manager = 0 Local connections = 0 Local connections executing in db manager = 0 Active local databases = 1 High water mark for agents registered = 13 High water mark for agents waiting for a token = 0 Agents registered = 13 Agents waiting for a token = 0 Idle agents = 8 Committed private Memory (Bytes) = 4947968 Switch list for db partition number 0 Buffer Pool Activity Information (BUFFERPOOL) = ON 11-05-2003 09:33:14.184819 Lock Information (LOCK) = ON 10-24-2003 11:08:45.878709 Sorting Information (SORT) = ON 11-05-2003 09:33:14.184821 SQL Statement Information (STATEMENT) = ON 11-05-2003 09:33:14.184815 Table Activity Information (TABLE) = ON 11-05-2003 09:33:14.184817 Take Timestamp Information (TIMESTAMP) = ON 10-24-2003 10:34:43.403708 Unit of Work Information (UOW) = ON 11-05-2003 09:33:14.184812 Agents assigned from pool = 355 Agents created from empty pool = 15 Agents stolen from another application = 0 High water mark for coordinating agents = 13 Max agents overflow = 0 Hash joins after heap threshold exceeded = 0 Total number of gateway connections = 0 Current number of gateway connections = 0 Gateway connections waiting for host reply = 0 Gateway connections waiting for client request = 0 Gateway connection pool agents stolen = 0 Memory usage for database manager: Memory Pool Type = Database Monitor Heap Current size (bytes) = 311296 High water mark (bytes) = 344064 Maximum size allowed (bytes) = 540672 Memory Pool Type = Other Memory Current size (bytes) = 5423104 High water mark (bytes) = 5439488 Maximum size allowed (bytes) = 15958016
Example 7-5: Output of a database snapshot
Database Snapshot Database name = TRADE3DB Database path = /home/db2inst1/db2inst1/NODE0000/SQL00002/ Input database alias = TRADE3DB Database status = Active Catalog database partition number = 0 Catalog network node name = Operating system running at database server= AIX Location of the database = Remote First database connect timestamp = 10-24-2003 11:08:45.657390 Last reset timestamp = 11-05-2003 09:35:14.167372 Last backup timestamp = Snapshot timestamp = 11-05-2003 13:51:35.622079 High water mark for connections = 9 Application connects = 4 Secondary connects total = 1 Applications connected currently = 4 Appls. executing in db manager currently = 0 Agents associated with applications = 4 Maximum agents associated with applications= 9 Maximum coordinating agents = 9 Locks held currently = 0 Lock waits = 0 Time database waited on locks (ms) = 0 Lock list memory in use (Bytes) = 3420 Deadlocks detected = 0 Lock escalations = 0 Exclusive lock escalations = 0 Agents currently waiting on locks = 0 Lock Timeouts = 0 Number of indoubt transactions = 0 Total Private Sort heap allocated = 0 Total Shared Sort heap allocated = 0 Shared Sort heap high water mark = 0 Total sorts = 4 Total sort time (ms) = 0 Sort overflows = 0 Active sorts = 0 Buffer pool data logical reads = 31 Buffer pool data physical reads = 3 Asynchronous pool data page reads = 0 Buffer pool data writes = 0 Asynchronous pool data page writes = 0 Buffer pool index logical reads = 2 Buffer pool index physical reads = 0 Asynchronous pool index page reads = 0 Buffer pool index writes = 0 Asynchronous pool index page writes = 0 Total buffer pool read time (ms) = 9 Total buffer pool write time (ms) = 0 Total elapsed asynchronous read time = 0 Total elapsed asynchronous write time = 0 Asynchronous data read requests = 0 Asynchronous index read requests = 0 LSN Gap cleaner triggers = 0 Dirty page steal cleaner triggers = 0 Dirty page threshold cleaner triggers = 0 Time waited for prefetch (ms) = 5 Unread prefetch pages = 0 Direct reads = 0 Direct writes = 0 Direct read requests = 0 Direct write requests = 0 Direct reads elapsed time (ms) = 0 Direct write elapsed time (ms) = 0 Database files closed = 0 Data pages copied to extended storage = 0 Index pages copied to extended storage = 0 Data pages copied from extended storage = 0 Index pages copied from extended storage = 0 Host execution elapsed time = 0.027284 Commit statements attempted = 161 Rollback statements attempted = 159 Dynamic statements attempted = 293 Static statements attempted = 2 Failed statement operations = 0 Select SQL statements executed = 209 Update/Insert/Delete statements executed = 16 DDL statements executed = 0 Internal automatic rebinds = 0 Internal rows deleted = 0 Internal rows inserted = 0 Internal rows updated = 0 Internal commits = 0 Internal rollbacks = 0 Internal rollbacks due to deadlock = 0 Rows deleted = 1 Rows inserted = 3 Rows updated = 12 Rows selected = 551 Rows read = 707 Binds/precompiles attempted = 0 Log space available to the database (Bytes)= 20400000 Log space used by the database (Bytes) = 0 Maximum secondary log space used (Bytes) = 0 Maximum total log space used (Bytes) = 8393003 Secondary logs allocated currently = 0 Log pages read = 0 Log pages written = 9 Package cache lookups = 225 Package cache inserts = 20 Package cache overflows = 0 Package cache high water mark (Bytes) = 3186052 Application section lookups = 293 Application section inserts = 20 Catalog cache lookups = 48 Catalog cache inserts = 0 Catalog cache overflows = 0 Catalog cache high water mark = 0 Workspace Information Shared high water mark = 0 Corresponding shared overflows = 0 Total shared section inserts = 0 Total shared section lookups = 0 Private high water mark = 838854 Corresponding private overflows = 0 Total private section inserts = 20 Total private section lookups = 205 Number of hash joins = 0 Number of hash loops = 0 Number of hash join overflows = 0 Number of small hash join overflows = 0 Memory usage for database: Memory Pool Type = Backup/Restore/Util Heap Current size (bytes) = 16384 High water mark (bytes) = 16384 Maximum size allowed (bytes) = 20660224 Memory Pool Type = Package Cache Heap Current size (bytes) = 4096000 High water mark (bytes) = 4505600 Maximum size allowed (bytes) = 4294950912 Memory Pool Type = Catalog Cache Heap Current size (bytes) = 638976 High water mark (bytes) = 638976 Maximum size allowed (bytes) = 4294950912 Memory Pool Type = Buffer Pool Heap Current size (bytes) = 4341760 High water mark (bytes) = 4341760 Maximum size allowed (bytes) = 4294950912 Memory Pool Type = Buffer Pool Heap Current size (bytes) = 671744 High water mark (bytes) = 671744 Maximum size allowed (bytes) = 4294950912 Memory Pool Type = Buffer Pool Heap Current size (bytes) = 409600 High water mark (bytes) = 409600 Maximum size allowed (bytes) = 4294950912 Memory Pool Type = Buffer Pool Heap Current size (bytes) = 278528 High water mark (bytes) = 278528 Maximum size allowed (bytes) = 4294950912 Memory Pool Type = Buffer Pool Heap Current size (bytes) = 212992 High water mark (bytes) = 212992 Maximum size allowed (bytes) = 4294950912 Memory Pool Type = Lock Manager Heap Current size (bytes) = 458752 High water mark (bytes) = 458752 Maximum size allowed (bytes) = 638976 Memory Pool Type = Database Heap Current size (bytes) = 1490944 High water mark (bytes) = 1490944 Maximum size allowed (bytes) = 6668288 Memory Pool Type = Other Memory Current size (bytes) = 0 High water mark (bytes) = 0 Maximum size allowed (bytes) = 12517376
7.1.2 Event monitor
The event monitor is a tool that allows you to monitor ongoing actions in the database server. It is a good tool for checking problems that are very difficult to handle using the snapshot monitor. One example is to find the reason for a deadlock situation. A deadlock event monitor waits for a deadlock to occur; when one does, it collects information about the applications involved and the locks in contention. Monitoring a deadlock situation with a snapshot monitor could be difficult. DB2 will roll back any transactions that are part of the deadlock situation except one that is allowed to finish the transaction. The timeframe for this action is very short; therefore, a tool like Event monitor, that records actions within a period of time, is better than one that collects the state in a point of time.
To create an event monitor, use the CREATE EVENT MONITOR SQL statement. Event monitors collect event data only when they are active. To activate or deactivate an event monitor, use the SET EVENT MONITOR STATE SQL statement. The status of an event monitor (whether it is active or inactive) can be determined by the SQL function EVENT_MON_STATE.
Another way to create and control event monitors is by using the Control Center. Figure 7-2 shows a capture of the Control Center with the event monitors view open. This is a good way to see if the monitors are running or not.
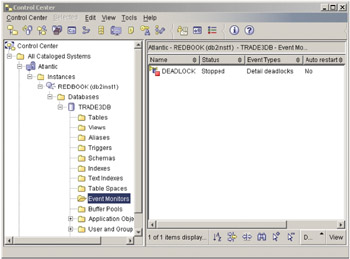
Figure 7-2: Event monitors from within Control Center
With DB2 UDB V8, you can store the monitor output in tables. Other options are to use files or named pipes. Be careful because event monitors gather a large amount of data. You should reserve enough space in the output directory or use tables to store the data. Using tables allows you to define exactly which data elements you want. Data that is not useful can be discarded. Once the data is stored in tables you can use SQL to retrieve the information. This is a very powerful and flexible way.
The SQL command you need to create an event monitor from outside of the Control Center is shown in Example 7-6.
Example 7-6: Syntax of CREATE EVENT MONITOR statement
>>-CREATE EVENT MONITOR--event-monitor-name--FOR----------------> .-,----------------------------------------------------. V | >----++DATABASE----------------------+--------------- --+-+----> | +-TABLES----------------------+ | | +-DEADLOCKS--+--------------+-+ | | | '-WITH DETAILS-' | | | +-TABLESPACES-----------------+ | | '-BUFFERPOOLS-----------------' | '-+-CONNECTIONS--+--+----------------------------+-' +-STATEMENTS---+ '-WHERE--| Event Condition |-' '-TRANSACTIONS-' >--*--WRITE TO--+-TABLE--| Table Options |----------+--*--------> +-PIPE--pipe-name-------------------+ '-FILE--path-name--| File Options |-' .-MANUALSTART-. >--+-------------+--*-------------------------------------------> '-AUTOSTART---' .-LOCAL--. >--+----------------------------------------+--*--+--------+--->< '-ON DBPARTITIONNUM--db-partition-number-' '-GLOBAL-' Event Condition .-AND | OR-----------------------------------------------------. V | |----+-----+--+-+-APPL_ID---+--+-=---------+--comparison-string-+-+--| '-NOT-' | +-AUTH_ID---+ | (1) | | | '-APPL_NAME-' +-<>--------+ | | +->---------+ | | | (1) | | | +->=--------+ | | +-<---------+ | | | (1) | | | +-<=--------+ | | +-LIKE------+ | | '-NOT--LIKE-' | '-(Event Condition)-------------------------------' Table Options |--*--+---------------------------------------------+--*--------> | .-,---------------------------------------. | | V | | '---evmGroup--+---------------------------+-+-' '-(--| targetTableInfo |--)-' .-BLOCKED----. >--BUFFERSIZE--pages--*--+------------+--*----------------------| '-NONBLOCKED-' targetTableInfo .-,------------------------------------------. V (2) | |-----------+-TABLE--tableName----------------+-+---------------| +-IN--tablespaceName--------------+ +-PCTDEACTIVATE--integer----------+ +-TRUNC---------------------------+ | .-,-------. | | V | | '-+-INCLUDES-+--(----element-+--)-' '-EXCLUDES-' File Options |--*--+-------------------------------+--*----------------------> | .-NONE------------. | '-MAXFILES--+-number-of-files-+-'
From the Control Center, the event monitors will be created using a wizard. Within the Control Center you can only see those event monitors that are defined to write to tables. To create an event monitor that stores the data in tables use this command:
DB2 CREATE EVENT MONITOR dlmon FOR eventtype WRITE TO TABLE
If you do not specify a table name, DB2 generates names for you. To find the table names DB2 generated use the following command:
DB2 SELECT * FROM SYSCAT.EVENTTABLES WHERE EVMONNAME = 'dlmon'
Or use DB2 LIST TABLES and look for tables like:
-
connheader_dlmon
-
conn_dlmon
-
deadlock_dlmon
-
dlconn_dlmon
-
dllock_dlmon
-
control_dlmon
Once you have chosen the table names you can start analyzing what the event monitor has collected. For example, if you want to look for the long-unning statements, use:
SELECT * FROM STMT_TEST WHERE START_TIME + 60 SECOND < STOP_TIME
If you chose to use a file to store the output of the event monitor you can analyze the results with the db2evmon command. This method is also useful but not so powerful like the one using SQL to analyze the collected data.
7.1.3 Explain utilities
When DB2 UDB is requested to retrieve data, it uses an optimizer to determine which access plan is the most efficient one. It is possible to see the access plan that DB2 UDB created and to view how expensive the retrieval is.
The optimizer uses several inputs to calculate the best access plan. Information like the speed and count of CPUs and disks is important. DB2 calculates the CPU speed during the installation and stores it in the database manager configuration parameter CPUSPEED. This value should not be changed unless you are modeling a different hardware environment. If you change the CPUs in a machine, you can set the value to -1 to have DB2 compute the new CPU speed. The access plans in your development environment can differ from the ones you have in the productive environment. So if you deploy your database to a productive system, it is necessary to look at the access plans again. Access plans can differ due to speed and number of CPUs and disks changed.
By default DB2 UDB assumes that you have very slow disks and calculates the access plan with that assumption. To have the best plan you need to tell DB2 the characteristics of your disks. For detailed information look at Chapter 4 of the Table space impact on query optimization in Administration Guide: Performance, SC09-4821.
Other very important information that the optimizer uses is the statistics of the tables. It is necessary to keep this information up to date and to rebind your applications once the statistics are re-collected.
It is possible to configure how intensivly DB2 UDB should search for the best access plan. You can choose between 10 optimization classes, where 0 means minimal optimization and 9 stands for using all available optimization techniques. By default DB2 UDB uses the optimization class 5 configured with the database configuration parameter DFT_QUERYOPT. You can change this default value or use DB2 SET CURRENT QUERY OPTIMIZATION = value when accessing the data with statements like:
SELECT PKGNAME, PKGSCHEMA FROM SYSCAT.PACKAGES WHERE QUERYOPT = CURRENT QUERY OPTIMIZATION.
The db2exfmt and Visual Explain utilities require the DB2 Explain tables to be built for each user who is executing the explain commands. The db2expln utility will dynamically explain static SQL and does not require the DB2 Explain tables. A variation of the db2expln utility, dynexpln, allows dynamic SQL to be explained without using the DB2 Explain tables. Further details on the db2expln and dynexpln utilities can be found by using the online help available within the DB2 Command Line Processor, by entering db2expln -h or dynexpln -h. These two explain utilities can be useful if the Explain tables are not created or if a user needs to run an explain but does not own a DB2 Explain table schema.
The easiest way to create an access plan is from the Command Center by choosing the menu Interactive -> Create Access Plan or using the icon ![]() . The explain tables will be created automatically if not still present. A message will inform you that the explain tables have been created. Another option to create explain tables is to run the EXPLAIN.DDL script that is located under sqllib\misc.
. The explain tables will be created automatically if not still present. A message will inform you that the explain tables have been created. Another option to create explain tables is to run the EXPLAIN.DDL script that is located under sqllib\misc.
For viewing the access plan you have several options. The graphical version can be seen in the Command Center when choosing the menu Interactive -> Create Access Plan. Figure 7-3 shows a simple example for the output for the statement:
SELECT * FROM ORDEREJB WHERE ORDERSTATUS = 'closed'.
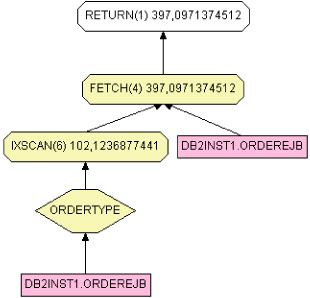
Figure 7-3: Visual explain
The db2exfmt utility will format the data contained in the DB2 Explain tables in a textual report that explains the access plans selected for each SQL statement that is contained in the DB2 Explain tables.
For more details we recommend the following DB2 UDB manuals:
-
Command Reference, SC09-4828
-
Administration Guide: Performance, SC09-4821
7.1.4 DB2 Diagnostic Log (DB2DIAG.LOG)
DB2 UDB provides a diagnostic capturing mechanism. It writes information into a file called DB2DIAG.LOG. By default, this file is written to:
-
On UNIX platforms
$INSTHOME/sqllib/db2dump directory
Where INSTHOME is the database instance home directory.
-
On Intel platforms:
-
If the DB2INSTPROF environment variable is not set:
x:\Program Files\IBM\SQLLIB\%DB2INSTANCE%
-
If DB2INSTPROF is set:
x:\%DB2INSTPROF%\%DB2INSTANCE%
Where x:\SQLLIB is the drive reference and directory specified in the DB2PATH registry variable. DB2INSTANCE is the name of the instance owner and DB2INSTPROF is the name of the instance profile directory.
-
In most situations, the default paths are adequate and need not be changed.
In DB2DIGA.LOG, you can find information like values of parameters that need to be increased, or errors that occurred, or lock escalations, and more. The value of the database manager parameter DIAGLEVEL defines what level of diagnostic information will be captured. The levels are:
-
0: No diagnostic data captured
-
1: Severe errors only
-
2: All errors
-
3: All errors and warning (default)
-
4: All errors, warnings, and informational messages
In general level 3 is sufficient. In a developing environment it is sometimes helpful to change to level 4 to have all the details captured. With level 4 you can, for example, see what Java environment is used by DB2. The IBM Support also needs this information. If possible use a level 4 diaglevel when you need support. The management of the DB2DIGA.LOG file is by the administrator, manually. This file can be deleted without impacting the DB2 UDB system. DB2 UDB will recreate the file if it is not exited.
7.1.5 Health Center/Memory Visualizer
The Health Center is a new feature of DB2 UDB Version 8. The Health Monitor gathers information about the health of the system using new interfaces that do not impose a performance penalty. It allows you to monitor the state and utilization of many parts of the database manager and databases. It automatically evaluates a set of health indicators. If the Health Monitor detects an abnormal state for an object, the Health Monitor will raise an alert. The health state of the system is presented using traffic light-like icons. Green indicates the state is normal. If you find a yellow or red state, you need to tune the system. You can set up the Health Center to inform you by e-mail if an alert occurs. You also can set up what should be done in a case of an alert so that the system can heal itself.
The Memory Visualizer is a part of the Health Center. With the Memory Visualizer you can monitor the memory usage like sort heaps, buffer pools, and caches. It displays the memory allocation for a particular instance and all of its databases. Because many of the memory configuration parameters are dynamic, you can change these parameters and monitor if your change has the expected result.
7.1.6 Design Advisor
Indexes play an important part in tuning the performance. An index is good when retrieving data because data access is, in general, much faster through an index than scanning an entire table to find matching rows. But having indexes is also an overhead. An index needs storage, and every insert and delete needs a write operation on the table and also on the index. If an update changes the value of an index field, an update on the index is also necessary. So indexes are important but not every index is helpful.
The Design Advisor is a wizard that can be started from the Control Center or from the command line using db2advis. The Design Advisor can help you design and define suitable indexes for your data. It can:
-
Find the best indexes for a problem query.
-
Find the best indexes for the set of queries that define in a workload, subject to resource limits that are optionally applied.
-
Test an index or materialized query table on a workload without having to create the index or materialized query table.
7.1.7 Configuration Advisor
The Configuration Advisor is another helpful tool for DBAs to evaluate and tune the database system. This graphical tool takes you step-by-step to gather the information about your system requirements. Once the process is completed, the Configuration Advisor provides you with the recommended database configuration parameter values for an optimal performance. These values can be applied immediately or later by Task Center or via the command line processor.
In Figure 7-4 we show the recommendations screen of the Configuration Advisor.
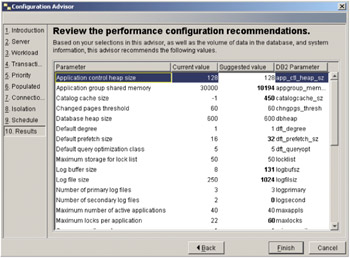
Figure 7-4: Configuration Advisor
|
| < Day Day Up > |
|
EAN: N/A
Pages: 90