Tool 189: Storyboarding
| AKA | Storyboard |
| Classification | Planning/Presenting (PP) |
Tool description
Storyboarding is a graphically illustrated representation of a complete story, concept, process, or implementation plan. It describes, in logical steps, all of the activities that need to be accomplished to complete a plan and demonstrate the results.
Typical application
-
To provide a flowchart of a process, concept, or planned activity.
-
To communicate the sequential activities and requirements of planned change.
-
To plan a project or develop a procedure.
Problem-solving phase
| Select and define problem or opportunity | |
| → | Identify and analyze causes or potential change |
| → | Develop and plan possible solutions or change |
| Implement and evaluate solution or change | |
| Measure and report solution or change results | |
| Recognize and reward team efforts |
Typically used by
| Research/statistics | |
| 1 | Creativity/innovation |
| Engineering | |
| 2 | Project management |
| Manufacturing | |
| 3 | Marketing/sales |
| Administration/documentation | |
| Servicing/support | |
| Customer/quality metrics | |
| Change management |
before
-
Information Needs Analysis
-
Brainstorming
-
Scenario Writing
-
Shewhard PDCA Cycle
-
Deming PDSA Cycle
after
-
Mental Imaging
-
Delphi Method
-
Different Point of View
-
Presentation
-
Run-It-By
Notes and key points
-
Storyboarding requires the complete story to be described, and illustrated text and graphics should logically sequence and display what takes place—or what should take place—from the beginning to end of the storyboard.
-
Storyboarding is a highly interactive process and requires the application of various tools. A facilitator should be engaged to guide a team through the process.
-
All text and graphics must be readable
-
A word-processing/graphics software package is needed to finalize team-produced drafts.
Step-by-step procedure
-
STEP 1 The team facilitator reviews the concept and required activities of storyboarding with the participants.
-
STEP 2 A flip chart is used to record brainstormed ideas or potential problems to serve as a topic for the storyboarding activity.
-
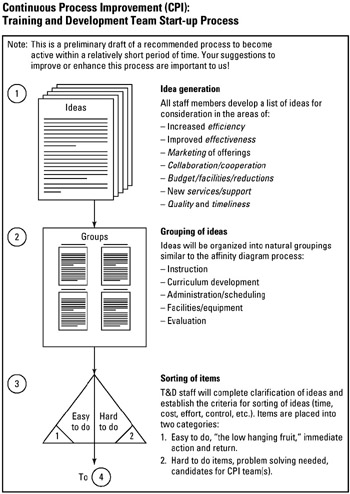
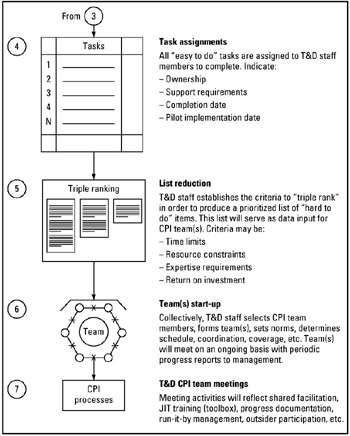
STEP 3 Once an idea has been selected, the team participants brainstorm the various required activity headings. See example Continuous Process Improvement (CPI): Training and Development Team Start-up Process.
-
STEP 4 Next, each activity is described and graphically illustrated on a white-board. All information is sorted, sequenced, and connected to reflect a process flow.
-
STEP 5 The team continues to create ideas to improve the storyboards. Detail is added until every participant is satisfied with the complete story, as shown in the example.
-
STEP 6 Finally, the draft is submitted to be finalized.
Example of tool application
Example of tool application
EAN: 2147483647
Pages: 326