Tool 190: Stratification
| AKA | Multiple Line Graph |
| Classification | Analyzing/Trending (AT) |
Tool description
The stratification method stratifies (separates) an existing set of data into sub-groups to determine what effect each subgroup of data has on an abnormal pattern or condition. Stratification helps in isolating and unmasking the real cause of a problem.
Typical application
-
To isolate abnormalities among data sets.
-
To break down and analyze abnormal distributions.
-
To verify the effects of subgroups to identify casue(s).
-
To identify root causes of total variation.
-
To analyze data to discover improvement opportunities.
Problem-solving phase
| → | Select and define problem or opportunity |
| → | Identify and analyze causes or potential change |
| Develop and plan possible solutions or change | |
| Implement and evaluate solution or change | |
| → | Measure and report solution or change results |
| Recognize and reward team efforts |
Typically used by
| 1 | Research/statistics |
| Creativity/innovation | |
| 5 | Engineering |
| 2 | Project management |
| 3 | Manufacturing |
| 6 | Marketing/sales |
| Administration/documentation | |
| 4 | Servicing/support |
| 7 | Customer/quality metrics |
| Change management |
before
-
Line Chart
-
Frequency Distribution (FD)
-
Data Collection Strategy
-
Checksheet
-
Observation
after
-
Variance Analysis
-
Problem Specification
-
Potential Problem Analysis (PPA)
-
Trend Analysis
-
Stratum Chart
Notes and key points
-
Encode and designate all subgroups plotted. Preferably add the "total group" graph for instant comparisons. Apply the 3:4 ratio graph construction rule.
Step-by-step procedure
-
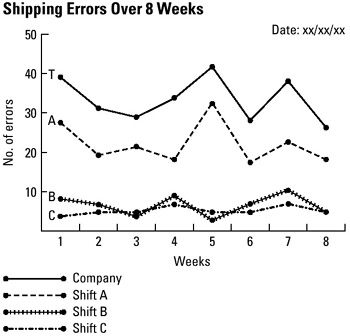
STEP 1 Collect and verify data to be plotted. See example Shipping Errors over 8 Weeks.
Wk1
2
3
4
5
6
7
8
Company Total:
40
32
30
34
41
29
39
27
Workshift A
28
20
21
19
33
18
22
18
Workshift B
8
7
4
8
3
6
10
4
Workshift C
4
5
5
7
5
5
7
5
-
STEP 2 Construct a stratification chart. The height of the vertical axis should be 75 percent of the length (100 percent) of the horizontal axis (3:4 ratio rule).
-
STEP 3 Plot the data using the error totals for 8 weeks of all 3 workshifts. Also plot the company totals.
-
STEP 4 Encode plotted data, designate lines, and label axes. Date the stratification chart.
Example of tool application
EAN: 2147483647
Pages: 326