Tool 191: Stratum Chart
| AKA | Surface Chart, Sarape Chart |
| Classification | Analyzing/Trending (AT) |
Tool description
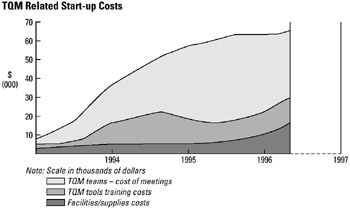
A stratum chart is an effective means to demonstrate cumulative additions of data that range from low to high and that are plotted along a horizontal time scale. Coloring or shading is used to differentiate among variables and to provide a quick interpretation of accumulation and relationships between plotted data.
Typical application
-
To show cumulative changes in data over time.
-
To display the effect of plotted variables, each variables' gradual change over time and relationships to each other.
Problem-solving phase
| → | Select and define problem or opportunity |
| → | Identify and analyze causes or potential change |
| Develop and plan possible solutions or change | |
| → | Implement and evaluate solution or change |
| → | Measure and report solution or change results |
| Recognize and reward team efforts |
Typically used by
| 1 | Research/statistics |
| Creativity/innovation | |
| 2 | Engineering |
| Project management | |
| 3 | Manufacturing |
| Marketing/sales | |
| Administration/documentation | |
| 4 | Servicing/support |
| Customer/quality metrics | |
| Change management |
before
-
Data Collection Strategy
-
Checksheet
-
Frequency Distribution (FD)
-
Trend Analysis
-
Sampling Methods
after
-
Major Program Status
-
Process Analysis
-
Monthly Assessment Schedule
-
Information Needs Analysis
-
Presentation
Notes and key points
-
Lines or curves cannot overlap.
-
Coloring or shading is needed to demonstrate the effect of cumulative changes in data plotted.
Step-by-step procedure
-
STEP 1 Collect historical data for variable to be plotted. See example TQM-Related Start-up Costs.
-
STEP 2 Scale the stratum chart to allow for highest cumulative number.
-
STEP 3 Plot the data along the horizontal time scale as shown in the example.
-
STEP 4 Color or provide pattern shading for variable data plotted.
-
STEP 5 Check the stratum chart for accuracy and provide date of issue.
Example of tool application
EAN: 2147483647
Pages: 326
- The Four Keys to Lean Six Sigma
- Key #1: Delight Your Customers with Speed and Quality
- When Companies Start Using Lean Six Sigma
- Making Improvements That Last: An Illustrated Guide to DMAIC and the Lean Six Sigma Toolkit
- The Experience of Making Improvements: What Its Like to Work on Lean Six Sigma Projects