Tool 124: Organization Chart
| AKA | Traditional Organization Chart |
| Classification | Planning/Presenting (PP) |
Tool description
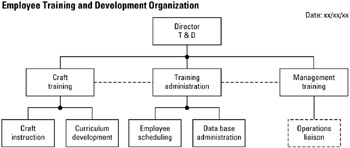
An organization chart typically shows the hierarchy and reporting relationships of functional units and their lines of communication and coordination. An organization chart is developed to provide employees with a common understanding of intergroup activities, communication channels, and levels of authority within the organization.
Typical application
-
To describe the formal organization.
-
To show an organization's divisions and subdivisions, functional relationships, and links of communication and responsibility.
Problem-solving phase
| Select and define problem or opportunity | |
| → | Identify and analyze causes or potential change |
| Develop and plan possible solutions or change | |
| Implement and evaluate solution or change | |
| Measure and report solution or change results | |
| → | Recognize and reward team efforts |
Typically used by
| Research/statistics | |
| Creativity/innovation | |
| Engineering | |
| 1 | Project management |
| Manufacturing | |
| Marketing/sales | |
| 2 | Administration/documentation |
| Servicing/support | |
| Customer/quality metrics | |
| Change management |
before
-
Block Diagram
-
Process Analysis
-
Tree Diagram
-
Work Breakdown Structure (WBS)
-
Work Flow Analysis
after
-
Organizational Mapping
-
Process Mapping
-
Markov Analysis
-
Task Analysis
-
Systems Analysis Diagram
Notes and key points
-
An organization chart is drawn from top to bottom, left to right. Organizations frequently show a hierarchical structure, with the highest level of authority at the top of the chart.
-
Solid lines indicate the direct or controlling relationships, dashed lines indicate indirect or coordinating relationships.
Step-by-step procedure
-
STEP 1 The team determines the organization to be charted and lists all divisions and subdivisions, direct and indirect relationships, lines of communications and responsibility.
-
STEP 2 A traditional organization is drawn on a white board or flip chart. See example Employee Training and Development Organization.
-
STEP 3 The finalized chart is checked for accuracy and dated.
Example of tool application
EAN: 2147483647
Pages: 326