Tool 123: Opportunity Analysis
| AKA | N/A |
| Classification | Evaluating/Selecting (ES) |
Tool description
The opportunity analysis is an effective tool for a team to evaluate and select the most preferred opportunity among many. Similar to criteria filtering, identified improvement opportunities are rated against criteria such as organizational importance, feasibility of completion, and potential benefit against resources needed to implement the top-rated choice.
Typical application
-
To identify and plan for implementing the most preferred improvement opportunity.
-
To provide a structured approach for teams to select high potential change.
-
To determine and use criteria for profitable resource allocation.
Problem-solving phase
| → | Select and define problem or opportunity |
| → | Identify and analyze causes or potential change |
| → | Develop and plan possible solutions or change |
| → | Implement and evaluate solution or change |
| Measure and report solution or change results | |
| Recognize and reward team efforts |
Typically used by
| Research/statistics | |
| 2 | Creativity/innovation |
| Engineering | |
| 3 | Project management |
| Manufacturing | |
| Marketing/sales | |
| Administration/documentation | |
| Servicing/support | |
| Customer/quality metrics | |
| 1 | Change management |
before
-
Cluster Analysis
-
Consensus Decision Making
-
Idea Advocate
-
Buzz Group
-
Checkerboard Method
after
-
Risk Space Analysis
-
What-If Analysis
-
Cost-Benefit Analysis
-
Sticking Dots
-
Run-It By
Notes and key points
-
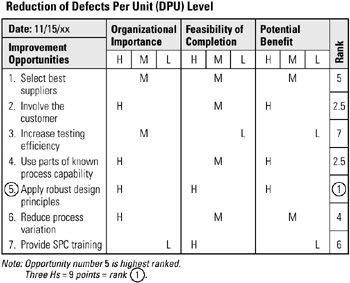
Legend: (H) = High, 3 points; (M) = Medium, 2 points; (L) = Low, 1 point.
-
Overall highest-rated improvement opportunity should be the top candidate for completion.
Step-by-step procedure
-
STEP 1 As a first step, the team facilitator introduces the opportunity analysis process. Rating criteria and final ranking is also discussed.
-
STEP 2 A prepared flip chart listing all of the opportunities is shown for the team to review and discuss.
-
STEP 3 Next, all criteria is clarified in order to have full understanding for the rating of listed improvement opportunities. See example Reduction of Defects per Unit (DPU) Level.
-
STEP 4 The team evaluates (rates) each opportunity, reaching consensus in the process.
-
STEP 5 A final ranking occurs and the top-rated improvement opportunity is identified.
-
STEP 6 The final chart is dated and next steps are briefly discussed.
Example of tool application
Reduction of Defects Per Unit (DPU) Level
EAN: 2147483647
Pages: 326
- RIP PE-CE Routing Command Reference
- Command Reference
- Case Study 2: Implementing Multi-VRF CE, VRF Selection Using Source IP Address, VRF Selection Using Policy-Based Routing, NAT and HSRP Support in MPLS VPN, and Multicast VPN Support over Multi-VRF CE
- Case Study 4: Implementing Layer 3 VPNs over Layer 2 VPN Topologies and Providing L2 VPN Redundancy
- Case Study 8: Implementing Hub and Spoke Topologies with EIGRP