Tool 87: Gantt Chart
| AKA | Gantt Planning |
| Classification | Planning/Presenting (pp) |
Tool description
A Gantt chart effectively documents the schedule of planned activities, milestone dates, and the assigned responsibility for completing the activities. Used as a project management tool, it tracks and monitors completion of goals, possible delays, and time left to target achievement. Critical milestone dates are placed on horizontal activity bars to enable the comparison of planned to actual performance. It is used as supporting data in a project status report.
Typical application
-
To schedule and monitor sequenced project activities.
-
To determine resource requirements, task responsibility, and time duration of the overall schedule of the project.
-
To manage the completion of a project.
Problem-solving phase
| Select and define problem or opportunity | |
| Identify and analyze causes or potential change | |
| → | Develop and plan possible solutions or change |
| Implement and evaluate solution or change | |
| → | Measure and report solution or change results |
| Recognize and reward team efforts |
Typically used by
| Research/statistics | |
| Creativity/innovation | |
| Engineering | |
| 1 | Project management |
| Manufacturing | |
| Marketing/sales | |
| Administration/documentation | |
| Servicing/support | |
| 3 | Customer/quality metrics |
| 2 | Change management |
before
-
Resource Histogram
-
Responsibility Matrix
-
Monthly assessment schedule
-
Work breakdown structure (WBS)
-
Program Evaluation and Review Technique (PERT)
after
-
Basili Data Collection Method
-
Objectives Matrix (OMAX)
-
Action plan
-
Major Program Status
-
Events log
Notes and key points
-
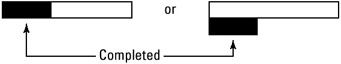
Legend: Various symbols are used. For this example:

-
Optional: To identify activity completed
Step-by-step procedure
-
STEP 1 The team facilitator records all necessary activities of a project on a flip chart. Activities were identified by team participants who represent or have knowledge of the work that needs to be completed.
-
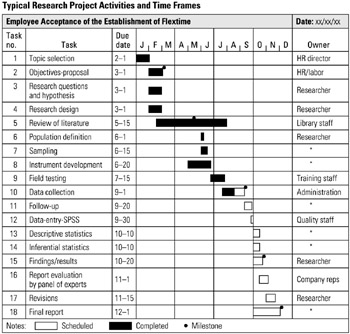
STEP 2 A basic Gantt chart is drawn on a whiteboard with a list of activities ordered by sequence of completion. See example Typical Research Project Activities and Time Frames.
-
STEP 3 The team estimates the time required for each activity. On that basis, an activity completion date (due date) is associated with every listed activity and recorded. Horizontal bars are drawn to represent time duration and the begin/end dates for each activity, as shown in the example.
-
STEP 4 Lastly, ownership (responsibility) is determined or assigned for the completion of each activity.
-
STEP 5 The team checks activities, sequence and duration, makes final revisions, and dates the chart. Once the chart is finalized, it is given to the project manager.
Example of tool application
EAN: 2147483647
Pages: 326