9.1 Demand
9.1 Demand
Much of the literature on software engineering economics focuses on the supply side, but the demand side is important as well because it provides insights into the value proposition for software and heavily influences pricing (see section 9.3). There are three distinct customer groups for software: those who provision, those who operate, and those who use. Sometimes two or three of these groups are in the same organization, or all three may be in different organizations. The value derived by users was discussed in chapter 3, and the considerations of provisioning and operations were taken up in chapter 5. Overall, suppliers must take into account the need of all these groups, trying to maximize the value while minimizing the costs incurred in provisioning and operations. The software industry is relatively immature, and doubtless many new ways will be found to add value and minimize costs in the future (see chapter 10).
Two influences on demand worthy of further discussion from an economic perspective are network effects and lock-in. First we delve more deeply into the idea of market penetration.
9.1.1 Market Share
Network effects (see section 3.2.3) apply when demand for a good is affected by the size of the network. Antitrust law and policy are concerned with market concentration (see section 8.2.5). Both of these concepts bear on market share. Reasonable indicators of market share for a given software product category include the fraction of unit sales, the fraction of total revenue from sales, or the fraction of total usage. Arguably usage would be the most direct indicator of the effect on or value to the total community, but direct network effects would be most directly affected by unit sales (related to the number of adopters ready and able to participate in the network), and revenue from sales would be the best predictor of future business prospects (related to profits and the ability to invest in maintenance and upgrades). For many goods and services, these different indicators might yield similar conclusions for a given product category, but they can diverge dramatically for software. Unlike most goods (e.g., hardware) software is not subject to material or resource limitations: it can be replicated, distributed, stored, and executed at very low marginal cost. Thus, there is low cost to both supplier and user associated with multiple adoptions by the same user, even where the adoptions are almost direct substitutes or are rarely used.
Example In the interest of sharing documents with others, a user might install a second word-processing program and use it infrequently. The supplier can encourage this by making available free or at a discount a version of its word processor that only installs when another vendor's program is already installed. Especially this discount is common practice under so-called competitive upgrade schemes. There is little cost penalty to the supplier, and it can help to tilt network effects in its favor. Of course, this would not apply to complex distributed or organizational applications, where there may be significant provisioning and operational costs.
Unit sales and usage can differ radically. Revenue and usage can also differ radically for software sold at a fixed price rather than priced according to some usage metric. Usage itself is difficult to define. In human terms, it might be defined as "face time" (or "eyeballs"), but software can be autonomous, operating independently of human involvement. In conclusion, the concept of market share should be treated with caution.
9.1.2 Direct and Indirect Network Effects
The discussion of network effects in section 3.2.3 distinguishes between two types of network effects: direct and indirect. It is helpful to clarify the difference between these using simple models and also to appreciate some influences of network effects on the dynamics of software markets.
Network effects predict that demand for a good is affected by the actions of other users. What is the appropriate determinant of value from network-effects in light of the alternative measures of market share discussed in section 9.1.1? For direct network effects, the best metric is usually the total size of the network (those able to use the product), and for indirect network effects the aggregate usage (those who regularly use the product, and how much they use it). To model network effects, we use network size (alternative definitions are easily substituted). Let n be the network size out of a total population of N. Assume that the demand in the absence of network effects is represented by d(n), interpreted as the nth consumer's willingness to pay (consumers are ordered from highest to lowest willingness to pay), or equivalently, the price at which the product will be sold to n consumers.
Example If the consumers are uniformly dispersed in their willingness to pay, and the first consumer is willing to pay p, then d(n) = p (N − n)/(N − 1). The first adopter is willing to pay p, the last is not willing to pay anything, and approximately half the consumers are willing to pay p/2 or more.
Network effects can be introduced by adding a second argument to the demand function, which is the total network size expected or anticipated by the nth consumer. Denote this second argument by n′ and the refined demand function by d(n, n′). The reason for using expected (not actual) network size is that there may be some divergence: the consumer lacks accurate information on the actual network size and may adopt on the basis of expected future growth in the network, and the supplier can manipulate expectations through effective marketing campaigns. With some loss of generality, this function can be factored: d(n, n′) = d(n) e(n′), 0 ≤ e(n′) ≤ 1, where the first factor is the demand in the absence of network effects and the second factor is the multiplier by which demand is reduced because all the consumers expect the network size to be n′. The simplification is that all consumers have the same expectation n′ on network size, and their willingness to pay is influenced in the same way. When everybody is expected to become an adopter, assume that d(n, N) = d(n) and hence e(N) = 1.
Example A widely cited estimate for direct network effects is Metcalfe's law (named after Ethernet pioneer Robert Metcalfe), which assumes that the willingness to pay of each consumer is proportional to the network size. If the boundary conditions are e(1) = 0 (a single adopter derives no value) and e(N) = 1, then e(n′) = (n′ − 1)/(N − 1). Metcalfe's law is usually stated as a function of the value of an entire network, which is the product of the value to each adopter and the network size, proportional to the square of the network size. Metcalfe's law is pessimistic in that it is likely each adopter has a natural community of interest and limited interest in connecting outside this community. In that case, the value of the product to an adopter would depend on adoptions within that community rather than on total network size.
The point at which consumer expectations are aligned with reality is a candidate for market equilibrium. This occurs at n = n′ with demand d(n, n) = d(n) e(n). The distinctive characteristic of a market with direct network effects is that d(1, 1) = 0 (because e(1) = 0, a single adopter derives no value). Demand actually increases with adoptions (because of the increasing e(n) actor) and ultimately starts decreasing again (because of the decreasing d(n) factor).
Example Total demand is plotted against market penetration (n/N) in figure 9.1 for a market obeying Metcalfe's law with uniformly dispersed willingness to pay and maximum willingness to pay p = 2. Notice that the maximum willingness to pay is considerably reduced by network effects (to 0.5).
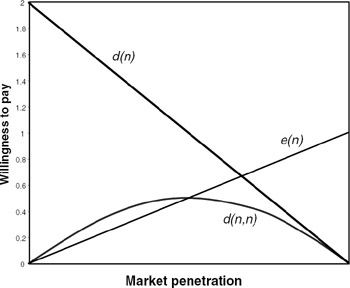
Figure 9.1: Demand function for uniformly dispersed willingness to pay and Metcalf's law for the direct network effect.
The distinguishing characteristic of a market with an indirect network effect is e(0) > 0, because the supplier can ensure that there is some supply of the complementary commodity available to the first adopter.
Example Assume the supplier makes an initial investment in supplying the complementary commodity and then increases its investment in proportion to revenue, which is likely in turn to be proportional to the network size (assuming no usage component to pricing). Thus, assume that e(n′) is linear between e(1) = g and e(N) = 1, 0 < g < 1, or e(n′) = ((1 − g)n′ + Ng − 1)/(N − 1). This model for the indirect network effect is plotted for g = 0.25 in figure 9.2, again for uniformly dispersed intrinsic demand. Note the larger demand at low network sizes. In fact, if g > 0.5 (the supplier is willing to make half or more of its full market penetration investment up front), demand is decreasing for all n.
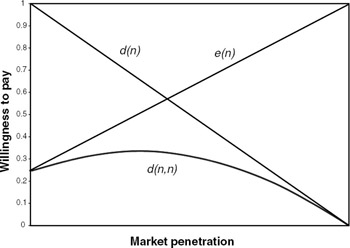
Figure 9.2: Demand for a uniform dispersion in willingness to pay and a model of indirect network effects, with g = 0.25.
In summary, where direct network effects reign, the supplier has to make a full investment to develop a product but faces a severe challenge in gaining initial adoptions because the initial demand is low regardless of the intrinsic merits of the product. With indirect network effects, the supplier of the primary product must make sure the complementary commodity is initially in good supply, an easier-to-address challenge.
The dynamics of the market are also of interest, as illustrated in figure 9.3 (Economides 1996). The supply curve (the unit costs assumed by the supplier) intersects the demand curve twice (if at all) for direct network effects, creating three equilibrium points (where supply equals demand). One is the unfortunate case where both supply and demand are zero; this equilibrium is stable because of negative feedback (a slight decrease in market share causes a reduction in demand resulting from network effects, further dampening demand). All products begin at this equilibrium, and it is difficult to circumvent. The next equilibrium is critical mass, where demand reaches supply and the supplier can price to recover costs. This equilibrium is unstable because market forces drive market share away, either up or down. In the up direction, the market experiences the virtuous cycle of positive feedback in which increasing market share stimulates greater demand, and the supplier can price the product to increase the size of the network while deriving a profit. Finally, the market reaches the third (stable) equilibrium, beyond which the consumers' willingness to pay doesn't offset costs.
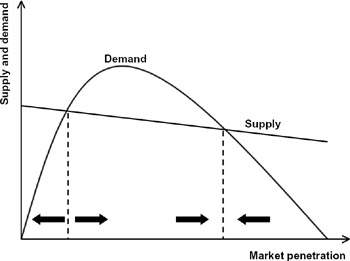
Figure 9.3: Market dynamics with direct network effects.
Indirect network effects have a similar market dynamic, where demand is initially increasing, but with the important distinction that the supplier has a ready way to stimulate initial demand by investing in the complementary asset (equivalently increasing g). For direct network effects it may be necessary initially to subsidize purchases to seed demand.
Network effects have a strong influence on the software industry, but with considerable differences among different types of software. Considering first infrastructure, before the Internet enabled communication among computers, different platforms could coexist and compete for the same customers. The primary source of value related to network size was success in attracting application developers to the platform, that is, indirect network effects. The platforms tended to segment the market: mainframes for back-office business applications, the personal computers for home productivity applications, and UNIX servers and workstations for the scientific and technical market and for departmental business applications. After the Internet attracted many users, the platform for distributed applications became collectively all types of computer platforms, the network, and any middleware (the middle layers in figure 7.5). Virtually all infrastructure suppliers need to consider prominently their role in an ecosystem of complementary as well as competitive suppliers.[1]
Prospective infrastructure solutions (hardware, operating systems, and middleware) today face two related forms of network effects. First, they must achieve a sufficiently large penetration to attract a reasonable suite of applications. Second, there is the chicken-and-egg obstacle that infrastructure offers value only to the extent that it attracts applications, but application developers are only interested in layering on infrastructure with a significant market penetration (see section 7.1 for a discussion of strategies to overcome this).
Some categories of applications also experience significant network effects. Most distributed applications today follow the client-server architecture, in part because this model experiences weaker indirect network effects: the first client of a new server-based application derives considerable value if information content is initially available (see section 4.5). If a server-based application depends on information content suppliers, its users may benefit significantly as the market penetration increases and more content is attracted. An advantage of the application service provider model is that installing software on many clients is not needed. On the other hand, applications that adopt the peer-to-peer architecture encounter stronger direct network effects. Examples include video conferencing, facsimile, and instant messaging. Nevertheless, since the Internet became operational, this model has enjoyed some significant successes because of the relative ease of distributing the necessary software over the network and (often) a willingness to make per-peer software available free.
Example In the peer-to-peer category are Napster (Sullivan 1999), which allowed users to share music files directly between home computers, and the Groove Transceiver (Bulkeley 2000), a collaboration application. In part because it offered free downloads, Napster was very successful until it ran into difficulties with the copyright law. If an application is sufficiently compelling, users will download peer software over the network as long as they feel it is benign (comes from a trusted source, and especially if signed; see section 5.4.6).
The peer software could be automatically shared with another user intending to participate in a peer-to-peer application, avoiding installation using mobile code (see section 4.4.3).
Example A software vendor could market a remote-conferencing application using a peer-to-peer architecture. To counter any initial dampening of demand due to direct network effects, the application might be licensed (for a price) to users with the condition that participating with another user without a paid license is permitted by creating a temporary free license for the other user and sharing the necessary software using mobile code. This has been demonstrated as an adjunct to a Java-enabled Web browser (Chang and Messerschmitt 1996).
9.1.3 Lock-in
Customers often have considerable switching costs in replacing one product with another, and this adds an impediment to competitive suppliers trying to attract customers (Farrell and Shapiro 1988; Shapiro and Varian 1999b). A complete provisioned application is composed of and depends on a number of complementary elements, including different application components and infrastructure equipment and software. There are also less tangible complementary investments, such as the training of workers and the costs of reworking the administration and operation of the software (see capter 5). Suppose the customer considers changing the supplier of one application or infrastructure element. There are likely to be switching costs.
Example Customers choose an infrastructure platform on the basis of available applications and intrinsic attributes (e.g., price, quality). Suppose a customer wants to adopt an attractive new application. This may require changing the platform—new equipment, new infrastructure software, retraining system administrators—and possibly replacing administrative and management tools. In turn, this might require replacing other applications with ones that utilize the same platform, unless those applications are portable (see section 4.4). Even a portable application may have to be relicensed. Any replacement application will incur acquisition and user training costs. If an application composes with other applications, it may be necessary to replace other applications or acquire or write new translation software. Simply adding a new platform will incur significant provisioning and operational costs. Because of these costs, many organizations are predisposed to supporting only a small number of platforms.
There are two distinct types of costs in acquiring a new software product. The direct acquisition costs are all the costs (equipment, software licensing, provisioning, training) associated with that product—these costs are largely under control of the supplier through pricing strategies. Other costs in excess of direct acquisition costs are collectively known as switching costs. Many switching costs are not under direct control of a new supplier, and to some degree they can be manipulated by an existing supplier.
Example An infrastructure supplier can increase switching costs for its existing customers by failing to directly support portability of application software. Then application suppliers are less likely to make their applications portable. The motivation for the infrastructure supplier is the added costs of replacing many applications if the customer contemplates switching to a new platform. Of course, the downside is reduced application availability, reducing the value of the platform to new adopters.
Any discussion of lock-in should not focus exclusively on equipment, provisioning, and operations. The most significant source of switching costs is often user training and redesign of associated business processes. If moving to a new supplier requires reengineering processes, reorganizing and training workers, and disrupting business during deployment, the switching costs can be very high.
If a monetary value is attached to switching costs, some simple modeling illustrates the opportunities and challenges presented by lock-in. Assume two suppliers are available to the customer that offer competitive products: existing supplier A and new supplier B. Let the total switching costs to move from supplier A to B be SA→B, and let the value (as measured by willingness to pay) for the two products be VA and VB (so that they are substitutes but not necessarily direct substitutes). Both the suppliers and the customer should ignore any sunk costs incurred in the past, and focus on all present and future costs. Assume the two suppliers have costs CA and CB, and they choose to charge prices PA and PB. If the costs (including switching costs) and the revenues are spread over time, these should be interpreted as present values; that is, all future prices/revenues and costs are discounted according to the time value of money.[2]
The consumer's total cost is the sum of the price paid to the supplier and the switching costs, P + SA→B. The customer will be indifferent between the two suppliers when its consumer surplus (excess of value over price) is equal for the two suppliers, VA − PA = VB − (PB + SA→B). Similarly, the two suppliers have producer surpluses (excess of revenue over cost), PA − CA and PB − CB. Finally, one or the other of the suppliers will be at a competitive advantage if three conditions are simultaneously satisfied: (1) the consumer is indifferent between the two suppliers, (2) the price can be set so that the advantaged supplier's surplus is positive (there is a profit opportunity), and (3) the disadvantaged supplier's surplus is zero or negative (there is no profit opportunity). Applying these three conditions, the competitive advantage can be gauged by comparing supplier A's value advantage, VA − VB, to supplier B's switching-cost-adjusted cost advantage, CA − (CB + SA→B). If (and only if) the former is larger than the latter, supplier A enjoys a competitive advantage and has a surplus equal to the difference, PA − CA = (VA − VB) − (CA − CB) + SA→B.
This producer surplus is essentially the asset value (present value of all present and future revenue minus cost) to supplier A of a locked-in customer. To reiterate, this price (and resulting surplus) forces supplier B's surplus to zero when the customer is indifferent, and supplier B would be unlikely to make a sale to the customer. The point to note is that supplier A has the benefit of a "headwind" facing supplier B that is equal to the switching costs; even where supplier B offers more value or has a lower cost, supplier A will still enjoy a competitive advantage if the switching costs are sufficiently large. Supplier B has two ways to gain competitive advantage—offer more value or experience lower costs—but must overcome the customer's switching costs: it must subsidize these costs with a lower price in order to render the customer indifferent. For the case of a perfect substitute product and equal costs, supplier A's surplus (the asset value of the customer) equals the switching costs.
The typical situation for the most common business model of selling periodic software upgrades is where the alternative supplier is offering its product as an alternative to an upgrade. The original supplier may have a marginal cost advantage because it has amortized a portion of its fixed costs in the original sale. The original supplier may offer an attractive upgrade price, both to compete against its own installed base (older versions) and the alternative supplier. There are a number of ways the original supplier can increase the switching costs, further adding to its competitive advantage. These include proprietary APIs, forcing composability with other applications to be reimplemented with any replacement supplier, and utilizing proprietary data representations that make it difficult to move information content to a replacement supplier. The original supplier must temper these tactics with the realization that they reduce the application's value to new (rather than upgrading) customers, who appreciate the significance of switching costs, too.
An alternative supplier can overcome lock-in by subsidizing the customer's switching costs, thereby reducing its own revenue. An alternative that is fairly unique to software is to reduce the customer's switching costs, for example, by incorporating one-way or two-way compatibility with the first supplier's product or offering API or data representation translators (Shapiro and Varian 1999b), but this is at the expense of added development costs.
Example Most individual productivity applications, including virtually all office suites, include import/export tools to read and write document formats defined by competing products. In addition, open standard formats such as XML and HTML are increasingly defusing the proprietary format lock-in. Many productivity applications also include user-selectable emulation modes to behave just like some competing product, for instance, by reassigning command keys to allow users familiar with the competing product to continue their keyboard habits, reducing their retraining overhead.
As discussed in section 8.1.1, software products can generally be operated side-by-side, allowing alternative suppliers to supply their products at a significant discount to their competitors' existing customers without having to convince customers to immediately substitute. Finally, as discussed in section 9.2.5, in a rapidly expanding market (as is often the case with software) acquiring new customers is as or more important than stealing them away from other suppliers, and thus lock-in is a less important consideration.
In infrastructure, layering significantly reduces switching costs, since new infrastructure capabilities can be added without abandoning the old (see section 7.1.3). In the operational environment, existing applications can continue to utilize lower layers directly even while new applications depend on added upper layers. Added layers are often utilized as a location for translations needed for application composability. This further explains an attraction of layering as a means of advancing the infrastructure. In fact, layering is a natural outcome of market forces in both the material and immaterial worlds, in part because it deals gracefully with switching cost issues.
9.1.4 Open Systems vs. Proprietary Solutions
Lock-in is an important (but not the only) consideration in the trade-off between open systems and closed proprietary solutions (see section 5.1.3). Open systems—systems that are modular with open standard interfaces and APIs—are attractive to customers because they readily allow competition in individual modules rather than at the system level, at least to the extent that suppliers actually use them. When the customer can mix and match modules from different suppliers, it allows the customer to replace one component with minimal switching costs. The competition at the component level rather than at the system level also increases competition (ideally improving price, quality, and performance parameters) for each component. On the other hand, there is the acquisition cost and time required to integrate components from different vendors or switching costs associated with integration of a replacement component.
At the other extreme, a proprietary monolithic solution offers a complete system solution to the customer, with no opportunity to choose different vendors for different modules. Advantageously, this shifts the burden of system integration costs from the customer to the supplier, where they are amortized over all customers, and the risk assumed by the customer is reduced. Monolithic products tend to be more manageable and usable because everything was designed to work together from the beginning. They also provide clearer accountability for problems, as there are fewer opportunities for "finger-pointing" among suppliers in system integration, which is important from a risk management point of view (section 6.6.3). However, monolithic solutions cannot be replaced in piecemeal fashion, and thus the switching costs associated with moving to a competitive supplier are high.
Example The divergent strategies of Apple Computer and IBM illustrate this. Apple offered the Macintosh as an integrated "as is" solution, including CPU, monitor, peripherals, hardware, and infrastructure software. Partly as a result, the Mac was easier to configure and extend in its early years. The IBM PC, on the other hand, followed an open systems approach, encouraging competition from vendors of peripherals and separating hardware and software vendors. This places more of a burden on both owners and suppliers to deal with many interoperability issues that arise when peripheral and software products from different vendors are integrated. It also resulted in attractive competitive options, attractive prices, and growing market share. Over time, the approaches have converged somewhat. Apple has encouraged more competition in peripherals, and industry initiatives in the Windows space like plug-and-play have made integration more seamless. Dell Computer has been successful in building desktop computers to customer specifications, taking on more integration responsibility itself.
The information appliance is a product offering an application as is in a package, including both application software and infrastructure software and hardware. Packaged appliances are more affordable because of reductions in hardware costs, and they are generally praised for ease of use. But consumers dislike having to own multiple appliances for multiple applications, each with a different user interface to learn. Appliances have also been criticized as inflexible, but this has been partly addressed by software upgrades. Appliances can internally bundle and utilize open system solutions from other vendors, even open source software.
Example TiVo is an information appliance providing a personal digital receiver capability for television. A TiVo offers many TV schedule search and navigation features, and allows the user to schedule programs for later recording and interactive viewing. It requires a phone connection so that it can download TV schedules and software upgrades, and features can be upgraded. It uses the open source Linux operating system and a commercial database management system, together with custom hardware and software.
Both open systems and monolithic approaches have strong advantages, and customers must simply evaluate which factors are most important to them. In practice, there is fertile middle ground, and most suppliers attempt to strike a balance. For example, products with monolithic solutions often provide open APIs that allow extensions by other vendors.
Example An office suite like Microsoft Office tends toward the monolithic approach, offering a collection of integrated applications that can easily share information. However, Microsoft may also provide APIs that allow applications to be extended and integrated into the Office other applications. In Office, the two primary avenues for extensions are ActiveX controls, which can be added to toolbars or embedded into documents to achieve new functionality, and Visual Basic for Applications (VBA), which can be used to build on Office as a platform for new applications. (The same APIs that Office applications provide to VBA are available for externally developed extensions.) In combination, these mechanisms are used to build industry-specific applications that require core Office capabilities, such as solutions for medical or accounting practices.
Similarly, the suppliers of products utilizing open systems try to gain advantage by two techniques. First, they encourage competition in complementary components—reducing cost and improving quality for their customers' integrated systems solution—while trying to differentiate themselves from competitors in their own space. Second, they often attempt to increase the switching costs incurred by customers considering replacing their components with competitive solutions. Sometimes these two strategies are at cross-purposes.
Example Operating system suppliers actively encourage applications for their platform, to benefit from the positive feedback of indirect network effects. They also try to encourage competitive options in each application category to improve price, quality, and performance of complementary products available to their customers. Besides applications competing above the operating systems, they try to encourage competition below, at the level of supported hardware extensions and matching device drivers. Similarly, they may increase competition in the complementary equipment by porting their operating system to more than one microprocessor. In so doing, however, they potentially reduce the switching costs of customers, giving them more opportunity to replace the operating system without replacing the equipment.
[1]A biological ecosystem is an oft-used and reasonably good analogy because its dynamics depend on a complex mix of complementary and competitive relationships among all organisms. Like the software industry, pairs of organisms often share complementary and competitive relationships at the same time. For example, a parasite depends on its host but also detracts from it.
[2]If the prevailing interest rate is r per unit time, then revenue (or cost) incurred at a future time t is discounted by ![]() .
.
EAN: 2147483647
Pages: 145