Lesson 1: Documenting a Running Network
The principal challenge in implementing a change on any network is to define the existing network and any limitations imposed by its hardware and software configurations. Comprehensive documentation is the key to conducting an effective and economical upgrade for any network. This lesson focuses on how to lay a foundation for making later network changes by documenting the network and looks at some useful tools that can help facilitate the process.
After this lesson, you will be able to:
- Document network components in order to establish a baseline for network performance.
- Identify tools that can help to document a network.
Estimated lesson time: 40 minutes
Documentation
Preparing and maintaining network records are essential tasks that will pay off when you need to implement changes to a network. Up-to-date documentation provides information about how the network should look and perform, as well as where to seek help if there are problems. Documentation developed for maintenance, upgrading, and troubleshooting should contain:
- A map of the entire network, including the locations of all hardware and details of the cabling.
- Server information, including the data on each server and the schedule and locations of backups.
- Software information, such as licensing and support details.
- Essential names and telephone numbers for vendors, suppliers, contractors, and other helpful contacts.
- Copies of all service agreements.
- A record of all problems, their symptoms and solutions, including dates, contacts, procedures, and results.
Documentation should be thorough, well-organized, and stored where it is readily available. While this might seem obvious, it is easy for documentation to be lost or the individual responsible for maintaining these records to leave the organization without training a successor.
Establishing a Baseline
As soon as the network is operational, it is time to establish a baseline, which is simply a documentation of the network's normal operating values. The baseline needs to be updated whenever users, hardware, or software are added to or subtracted from the system.
Creating a good inventory and establishing baseline performance values form the basis upon which you can identify future needs for network modification.
The list that follows includes the steps you need to take to document the network:
- Record the model, serial number, and location of the servers, workstations, and routers. Record the warranty information for each device.
- Make a note of where all warranty information is stored. This will be helpful when a product needs servicing or replacement.
- Make a copy of important computer files such as AUTOEXEC.BAT and CONFIG.SYS. Make a complete set of system backup tapes. Copies of important tapes should be kept offsite in a safe deposit box or commercial offsite data storage facility. (See Chapter 10, "Ensuring Network Security," for a discussion of network backup systems.)
- Create a map of your network, noting the approximate distance between the workstations and the server. Make a note of areas where a cable goes through a wall or is placed in the plenum area between the ceiling and the floor above. This will be helpful to network and building architects in planning for future network modifications. Your documentation of cable runs can facilitate building inspections and help to demonstrate compliance with regulations such as fire codes that prescribe rules for cables placed in the plenum area of a building, as depicted in Figure 12.1. (Fire codes are discussed in Chapter 2, Lesson 1: Network Cabling.)
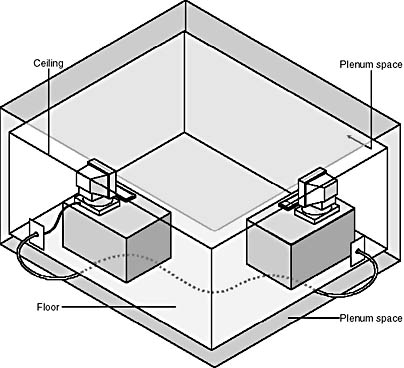
Figure 12.1 The plenum space
Understanding how a healthy network functions is as important as knowing how to solve problems after the network has failed. Monitoring and documenting the network when it is performing well provide baseline measurements against which unusual performance can be compared.
The baseline must be established over time before anything goes wrong. After a baseline exists, all network behaviors can be compared to it as part of the ongoing monitoring process.
The baseline is especially helpful in establishing and identifying:
- Daily network-utilization patterns.
- Bottlenecks.
- Heavy-usage patterns.
- Different protocol traffic patterns.
Documenting Network Performance
After the hardware has been documented and your network is in operation, it is almost time to record the network performance baseline. However, it is best to wait to do this until you have verified that all network connections are correct, all hardware is operational, and any necessary system fine-tuning has been accomplished. When the network's performance has been determined to be acceptable, it is time to record the baseline.
The concept of network performance is a broad one that encompasses the entire network, including:
- Servers.
- Network interface cards (NICs).
- Cable connections to the NICs.
- Hubs.
- Cable runs.
- Routers.
- RJ-45 wall plates.
- Workstation NICs.
A selection of tools is available to help administrators document network performance, including network monitors, protocol analyzers, and other utilities.
Network Monitors
A network monitor is a useful tool that captures and filters data packets and analyzes network activity. It is easy to document the network performance indicators with a network monitor, but it takes extra practice to quickly analyze the network performance statistics. Some network operating systems include network monitoring software among their resources, and a number of other software manufacturers also offer network monitors.
Protocol Analyzers
A protocol analyzer is a tool that keeps track of network statistics. It can capture bad frames and isolate their source. (Data frames are packets of information transmitted as a unit on a network. They are defined by the network's data-link layer and exist only on the wire between network nodes.) A protocol analyzer can be helpful for a company that has a large network with a highly trained staff.
Various protocol analyzers exist. Protocol analyzers can be inexpensive software programs that run on existing networked computers. More advanced and more expensive protocol analyzers are special-purpose portable computers that can be connected to any physical portion of the network to better isolate data-transmission problems.
Packet Internet Groper (Ping)
To test if your network connection is complete from the server to the workstation, you can use a simple utility, the Packet Internet Groper, better known as "ping." The ping utility works by sending a message to a remote computer. If the remote computer receives the message, it responds with a reply message. The reply consists of the remote workstation's IP address, the number of bytes in the message, how long it took to reply—given in milliseconds (ms)—and the length of time-to-live (TTL) in seconds. If you receive back the message "Request timed out," this means that the remote workstation did not respond before the TTL time expired. This might be the result of heavy network traffic or it might indicate a physical disconnection in the path to the remote workstation.
The following is an example of the ping utility:
C:\>Ping 125.55.222.1 Reply from 125.55.222.1: bytes=32 time=100 ms TTL=50 Reply from 125.55.222.1: bytes=32 time=100 ms TTL=50 Reply from 125.55.222.1: bytes=32 time=100 ms TTL=50 Reply from 125.55.222.1: bytes=32 time=100 ms TTL=50 |
Figure 12.2 shows an example of a ping utility.
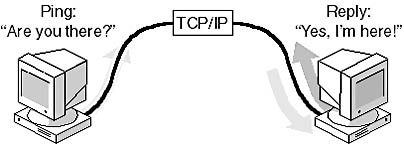
Figure 12.2 Ping utility
Tracert
Another utility that documents network performance is called "tracert." The UNIX equivalent is called "traceroute." While the ping utility merely lets us know that the connection from A to B is complete, tracert informs us of the route and number of hops the packet of data took to arrive at its destination.
Here is a simplified example of a tracert response:
"Tracing route to 100.50.200.10 over a maximum of 30 hops from Widgets in Ozona Fl to Widgets in Seattle WA." 1 125 ms 150 ms 155 ms Widgets.Ozona.Fl .gte.net 2 160 ms 165 ms 170 ms BZNet.Memphis.TN 3 175 ms 180 ms 185 ms Mtnnet Denver. CO 4 190 ms 200 ms 210 ms Widgets, Seattle.WA mci.net |

Run the c12dem01 video located in the Demos folder on the CD accompanying this book to view a presentation of the ping and tracert utilities.
Other Software Tools
Other software tools that document network performance include a variety of utilities that work with the TCP/IP protocol.
Ipconfig
This diagnostic command displays all current TCP/IP network-configuration values. This command is useful on systems running DHCP, allowing users to determine which TCP/IP configuration values have been configured by DHCP.
Winipcfg
A Windows 95 and 98 troubleshooting utility that enables users to access information about TCP/IP and network interface card settings. Winipcfg displays the physical address, IP address, subnet mask, and default gateway settings of the primary TCP/IP NIC (or settings of multiple NICs if more than one is installed).
Netstat
This command is available only if the TCP/IP protocol has been installed. Netstat displays all connections and listening ports, Ethernet statistics, addresses and port numbers, protocol connections and statistics, and the contents of the routing table.
Nbtstat
Nbtstat is available only if the TCP/IP protocol has been installed. It displays protocol statistics and current TCP/IP connections using NetBIOS over TCP/IP. This utility can list:
- A remote computer's name table.
- The remote computer's name table using its IP address.
- The contents of the NetBIOS name cache, giving the IP address of each name.
- Local NetBIOS names.
- Name resolution statistics for Windows networking name resolution.
Nbtstat can also:
- Display both client and server sessions, listing the remote computers by IP address only.
- Display both client and server sessions. It attempts to convert the remote computer IP address to a name using the HOSTS file.
Bottlenecks
Most network activities involve the coordinated actions of several devices. Each device takes a certain amount of time to perform its part of the transaction. Poor performance results when one of these devices uses noticeably more CPU time than the others. The problem device is referred to as a bottleneck. Performance monitoring can help identify and eliminate bottlenecks.
Finding bottlenecks is usually an indication that upgrading a portion of the network is necessary. To resolve bottleneck problems, an administrator must be able to identify the devices that are taking more time than they should to perform their tasks. Administrators can use performance monitors, included with the major network operating systems, to identify bottlenecks.
These devices tend to become bottlenecks:
- CPUs
- Memory
- Network cards
- Disk controllers
- Network media
A device becomes a bottleneck for one of the following reasons:
- It is not being used efficiently.
- It is using other resources or CPU time more than it should.
- It is too slow.
- It does not have the capacity to handle the load placed on it.
Proper monitoring will uncover these situations and provide information to help identify the problem component or components.
Documenting Server Performance
Server performance is usually affected by an increase in the number of users who are on the system. Comparing current server performance statistics with your initial baseline information can help you confirm a suspicion that the server is not running as well as it once did. However, your first hint that the server is not performing well is just as likely to come from the end users. Their daily use and familiarity with system response is a good indicator of server performance. (Chapter 13, "Troubleshooting a Network," discusses how to interview users when troubleshooting network problems.)
Performance monitors—software that is included on most operating systems—track server performance on a network and can monitor several system functions, displaying the results in tabular or graphical format. Certain indicators can help locate and isolate problems with server performance, including:
- Demand for server resources.
- Areas of data congestion.
- The activity of an individual process.
A performance monitor can observe the performance of a remote system and alert the system administrator to server conditions that need attention. It can also transfer data from the performance monitor to other performance tools.
Total System Management
As networks have grown in size and complexity, keeping track of an entire system has become more challenging. Because of this, vendors have developed utilities that do for system management what performance monitors have done for system monitoring. These system-wide management applications provide centralized management for distributed systems programs.
System-management software provides centralized administration of computers in a WAN. This service includes:
- Collecting hardware and software inventory information.
- Distributing and installing software.
- Sharing network applications.
- Troubleshooting hardware and software problems.
The system management software complements other system management utilities found in the network operating system. The examples that follow use Microsoft's Systems Management Server to illustrate these utilities.
Inventory Management This software collects and maintains an inventory of hardware and software for each computer and stores the inventory in a database. Typical inventory items include the type of CPU, amount of RAM, hard-disk size, operating system, and application software for each component installed.
Software Distribution After a computer's inventory has become part of the database, a software distribution utility can install and configure new software or upgrade previously installed software directly on a client. This distribution mechanism can also be used to run commands, such as virus scans, on clients. Figure 12.3 shows Microsoft NT Server's Systems Management Server distributing software.
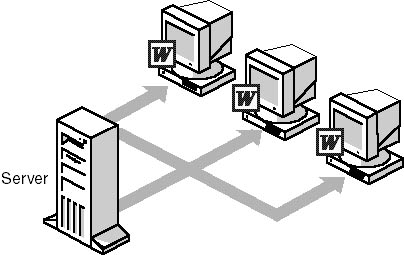
Figure 12.3 Systems Management Server distributes software
Shared Application Management Shared applications can also be distributed to a server for clients to access. When a user logs on to the network, the management software builds a program folder on each client. See Figure 12.4 for an example. These program folders in turn contain more folders that include the program icons representing the shared applications available to the user. To start the shared application, the user selects an icon from the program folder displayed on the local workstation. (The application is actually stored on the server's hard disk.)
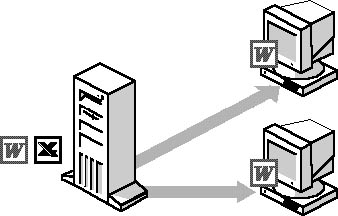
Figure 12.4 Systems Management Server simplifies application sharing
Remote Control and Network Monitor Systems Management Server, shown in Figure 12.5, provides Help Desk and diagnostic utilities that allow you to control and monitor remote clients directly. The diagnostic utilities let you view the client's current configuration. The Help Desk utilities provide direct access to a remote client.
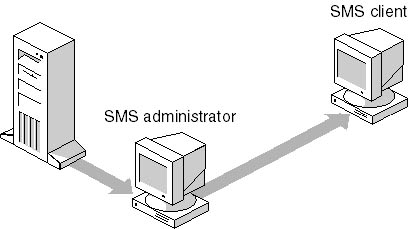
Figure 12.5 Systems Management Server simplifies remote client maintenance
Table 12.1 illustrates the environments supported by Systems Management Server:
Table 12.1 Environments Supported by Systems Management Server
| Environment | Supported |
|---|---|
| Network operating systems | Windows NT Server 3.51 and later; Windows 2000 Server; LAN Manager 2.1 and later; Novell NetWare 3.1x and 4.x; IBM LAN Server 3.0 and 4.0; any network protocol supported by Windows NT Server, including TCP/IP and IPX |
| Client computers | Windows 3.1 and Windows for Workgroups 3.11; Windows 95 and 98; Windows NT Workstation 3.5 and later; Windows 2000 professional; MS-DOS 5.0 and later; IBM OS/2 2.x, and OS/2 WARP; Apple Macintosh (System 7 and later) |
Maintaining a Network History
Documenting a network's history is as important as monitoring its real-time performance. A network's written record can:
- Indicate significant performance or equipment issues that real-time monitoring might miss.
- Provide a background against which current information can be compared.
If there is more than one administrator, it is important that they all record in only one shared logbook. This log can become an invaluable guide to future administrators who might need to trace a performance problem or resolve network issues related to system growth as well as equipment, maintenance, and system configuration changes.
This document should record:
- Purchase and installation dates and descriptions.
- Complete descriptive information about key individuals, such as contractors responsible for installation.
- Vendor, model, and warranty information, including serial numbers.
- The installation process and its results.
- The initial and subsequent network configurations.
- Network usage policies and procedures.
- Network resources and drive assignments.
- Copies of crucial network configuration files, such as CONFIG.SYS and .BAT files.
- Any unusual application program configurations.
- Any particular computer, board, or peripheral settings.
- Any problems and their solutions.
- Hardware or software changes.
- Any activities that affect the topology or architecture.
It is important that all network historical documentation be easy to access and easy to read. Graphics or even hand-drawn sketches can be very helpful.
A network's history can be either logged online or in a notebook. Keeping the log in a computer file can cause difficulties, however, especially if the file is stored on a hard disk and the computer or disk crashes. Should such an event occur, this is exactly the type of behavior the log should record.
![]()
Lesson Checkup
- What is a baseline of network performance? Why should you have one? How can you use it to determine if changes should be made to the network?
- What are network monitors and protocol analyzers? What part do they play in documenting network performance? In what ways can they alert you to degradation of network performance?
- Should the documentation that makes up a network history include specific information about the network's hardware and software? If so, why?
Answers
Lesson Summary
The following points summarize the main elements of this lesson:
- By creating a good inventory and a baseline of performance values, you can establish a benchmark against which to compare network performance in the future and identify any needed modifications.
- A network monitor is used to capture and filter data packets and analyze network activity.
- A protocol analyzer is a tool that is used to track network statistics.
- Ping and tracert utilities are used to confirm network connections.
- The ipconfig utility that displays current TCP/IP network configuration values is useful on systems running DHCP because it allows users to determine which TCP/IP configuration values have been configured by DHCP.
- Identifying network bottlenecks will help to determine what network components need to be upgraded.
- Performance monitors are tools that can be used to track server performance.
- Network operating system manufacturers have created system-management software to aid with monitoring and managing the total system.
- After establishing a baseline, the administrator needs to maintain a history of the network by documenting any subsequent changes and their impact on the system.
EAN: 2147483647
Pages: 106