Debugging with Internet Explorer and the Microsoft Script Debugger
|
|
In cases where you don’t have access to Visual Studio .NET 2005 but need to debug ASP.NET AJAX pages and associated scripts, the Microsoft Script Debugger can be used to view and debug scripts and step through code line by line. The Script Debugger has been around for several years as a stand-alone product that can run on a variety of Microsoft operating systems, including Windows NT 4, Windows 2000, Windows Server 2003, Windows XP, and Windows Vista. It can be downloaded from http:// www.microsoft.com/downloads/details.aspx?FamilyID=&DisplayLang=en (this URL is, of course, subject to change).
Once installed, the Script Debugger is automatically triggered when you select View![]() Script Debugger
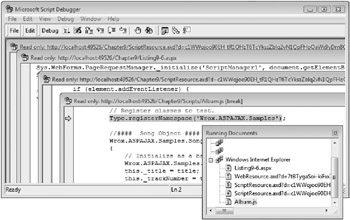
Script Debugger![]() Open (or Break at Next Statement) from the Internet Explorer menu. While the Script Debugger isn’t as robust as the debugger built into Visual Studio .NET 2005, it is very functional and can help identify problems encountered in ASP.NET AJAX applications. Figure 9-13 shows what the Script Debugger looks like in action.
Open (or Break at Next Statement) from the Internet Explorer menu. While the Script Debugger isn’t as robust as the debugger built into Visual Studio .NET 2005, it is very functional and can help identify problems encountered in ASP.NET AJAX applications. Figure 9-13 shows what the Script Debugger looks like in action.

Figure 9-13
You can view all of the scripts used in the page through the Running Documents window and set and remove breakpoints by placing the cursor on the line where you’d like to set (or remove) a breakpoint and then selecting the appropriate icon on the toolbar. The hand icon sets breakpoints, and the hand with a red “X” over it removes breakpoints. Scripts that are dynamically loaded in the page through ScriptResource.axd and WebResource.axd don’t present a problem and are directly accessible to step into without any extra effort on your part.
Once the Script Debugger is started, you can step through code by pressing F8, step over code by pressing Shift+F8, or step out of code by pressing Ctrl+Shift+F8. Alternatively, you can select the appropriate icons on the toolbar to step through the code. As you step through code, you can view variables and their values by using the Command Window. Type the variable name or object function that you want to call, and it will be displayed.
Figure 9-14 shows an example of the windows available in the Script Debugger.

Figure 9-14
| Tip | While you can run Visual Studio .NET 2005 and the Microsoft Script Debugger on the same machine, if you uninstall the Script Debugger, you may notice that the Script Debugger menu entry no longer appears in Internet Explorer or that Visual Studio .NET doesn’t handle calls to Sys.Debug.fail. This can be fixed by performing a repair on the Visual Studio .NET installation. |
|
|
EAN: 2147483647
Pages: 107