Enabling Internet Explorer for Debugging
Debugging JavaScript has proven to be somewhat of a challenge and has resulted in many developers resorting to “alert style” debugging to better understand how an application is working. Fortunately, Internet Explorer 6 or higher includes integrated debugging functionality that can be used to start a debug session and step through ASP.NET AJAX code with a debugging tool such as Visual Studio .NET 2005 or Microsoft’s Script Debugger, as shown in the following sections. Learning how to leverage
Internet Explorer debugging features can enhance your productivity and significantly minimize the amount of time you spend hunting down bugs and other issues. The debug capabilities in Internet Explorer 6 or higher are disabled by default but can be turned on by going to Tools![]() Internet Options
Internet Options![]() Advanced. The Advanced tab defines two items that need to be unchecked (a check means you can’t debug):
Advanced. The Advanced tab defines two items that need to be unchecked (a check means you can’t debug):
-
Disable script debugging (Internet Explorer)
-
Disable script debugging (Other)
Also, check the “Display a notification about every script error” check box below these items so that you’re notified as errors occur in a page. If this box isn’t checked, an icon will appear in the lower-left corner of the browser; unless you click, it you may miss noting that a client-side error occurred. A side-effect of checking this check box is that you’ll find that many other websites have errors as you browse to them, so you may want to leave it unchecked when you’re not debugging your own applications.
Figure 9-7 shows what the Internet Explorer Advanced settings should look like to enable debugging.
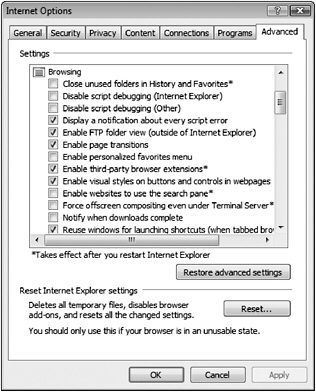
Figure 9-7
Once debugging is enabled in Internet Explorer, an ASP.NET AJAX page can be debugged using several techniques. The following sections walk you through the options.
Debugging with Internet Explorer and Visual Studio .NET 2005
You can start a debug session several different ways. One of the easiest ways is to use the built-in script debugging capabilities of Internet Explorer. To start a debug session for an ASP.NET AJAX page, navigate to the page that you’d like to debug and select View![]() Script Debugger from the Internet Explorer menu (see Figure 9-8). For this to work, you must enable Internet Explorer for debugging as described in the previous section.
Script Debugger from the Internet Explorer menu (see Figure 9-8). For this to work, you must enable Internet Explorer for debugging as described in the previous section.
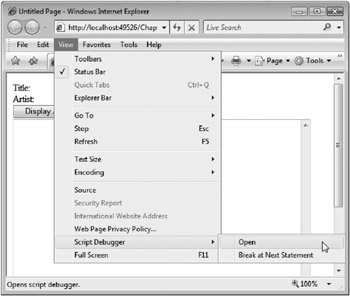
Figure 9-8
You’ll be presented with two different options, Open and Break at Next Statement, as shown in Figure 9-8. If you select Open, you’ll be prompted to start using Visual Studio .NET as the debugger, as shown in Figure 9-9. If Visual Studio .NET is already open, you can begin debugging, or you can choose to start a new instance of Visual Studio .NET to use for debugging. If you select Break at Next Statement, nothing will happen until an action is performed that causes script within the page (or script referenced by the page) to execute. Once script code is executed in Internet Explorer, you’ll be prompted to use the Visual Studio .NET Just-In-Time debugger.
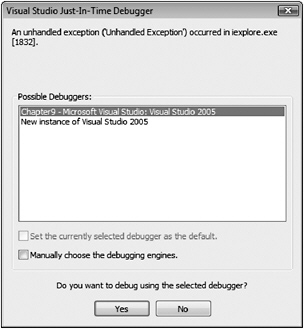
Figure 9-9
Once Visual Studio .NET is open and available for debugging, you won’t be able set a breakpoint if the script is embedded within the page. Instead, you’ll see a message at the bottom of the Visual Studio .NET status bar that states “This is not a valid location for a breakpoint” when you try to set the breakpoint. There are several ways to solve this problem. First, you can add the JavaScript “debugger” statement directly into the code where you’d like to start a debug session, which will force a breakpoint to occur at runtime at that location in your code. However, ASP.NET AJAX’s Sys.Debug class (discussed in the previous section) is designed for this purpose and is a more appropriate choice for debugging AJAX applications. You can call the Sys.Debug class’s fail function to trigger the debugger when a specific line of code is hit.
The Sys.Debug.fail function accepts only one parameter that represents the reason for the failure. Listing 9-12 shows an example of using the Sys.Debug.fail function to break into a debug session right before songs are added into an Album object.
Listing 9-12
var album = new Wrox.ASPAJAX.Samples.Album(); album.set_title("Sam's Town"); album.set_artist("The Killers"); //Force the debugger to appear Sys.Debug.fail("Debug song additions"); album.addSong(new Wrox.ASPAJAX.Samples.Song(3,"When you were young")); album.addSong(new Wrox.ASPAJAX.Samples.Song(7,"Uncle Johnny")); $get("lblTitle").innerHTML = album.get_title(); $get("lblArtist").innerHTML = album.get_artist(); It’s helpful to call Sys.Debug.fail to trigger a debug session when a line of JavaScript code is executed, but you must remember to remove all these calls before moving an application to a production environment, because it will always trigger the debugger when debugging is enabled in Internet Explorer. You can have two versions of your script (Microsoft does this with its debug and release scripts) and set the appropriate ScriptMode on the ScriptManager to determine which script is loaded at runtime, as discussed at the beginning of this chapter. Although this means that your code is duplicated, the release script can have all whitespace characters stripped out of it to minimize its size, while the debug script can provide an easy-to-read script that contains the necessary calls to the Sys.Debug class for debugging, tracing, assertions and other operations.
Another option for triggering the debugger when the script is embedded in the page is to move all of the JavaScript code in the page into its own script file, instead of including it directly in the .aspx page. In this case, a separate file with an extension of .js is referenced by the page to be loaded separately at runtime, instead of being sent down to the browser along with the HTML markup. After you’ve done this you can set a breakpoint in the external script file. Figure 9-10 shows an example of JavaScript in a file named Listing9-12.js that has a breakpoint successfully set.
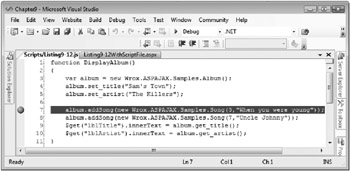
Figure 9-10
As you step through the code by pressing F11 (step into) or F10 (step over), you may be prompted to select the location of dynamically loaded script files needed by ASP.NET AJAX, or you may encounter an error that states “There is no source code available for the current location.” This occurs when you try to step into dynamically generated script code that was loaded using the ScriptResource.axd and WebResource.axd HTTP handlers, so in this case, there isn’t a separate physical file that Visual Studio can walk through. Although this problem can be frustrating at first, a simple tool that’s already part of Visual Studio .NET can alleviate this problem.
| Tip | Visual Studio .NET 2005 SP1 helps resolve this issue: however, knowing how to deal with the error if it arises is still helpful. |
Visual Studio .NET 2005 includes a very functional tool called the Script Explorer that can be used to navigate through scripts within a page. The Script Explorer can be used to load dynamic scripts in the editor so that you can step into them easily using the debugger and avoid the dreaded “There is no source code available for the current location” error. If you are prompted to load a script file, simply cancel the dialog box (or if you receive the aforementioned error, click OK). Select Debug![]() Windows
Windows![]() Script Explorer (or press Ctrl+Alt+N) to view the Script Explorer window. Double-click the page currently being debugged to open it in the editor, and then double-click all of the other script files shown. This will open all of the files referenced by the page in Visual Studio .NET so that the debugger can access the necessary source code to allow for a rich debugging experience.
Script Explorer (or press Ctrl+Alt+N) to view the Script Explorer window. Double-click the page currently being debugged to open it in the editor, and then double-click all of the other script files shown. This will open all of the files referenced by the page in Visual Studio .NET so that the debugger can access the necessary source code to allow for a rich debugging experience.
Figure 9-11 shows an example of the Script Explorer and the script files used in an ASP.NET AJAX-enabled page named Listing9-12.aspx.
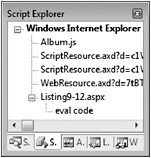
Figure 9-11
| Tip | As you step through code during a debug session, you may notice that as you mouse over JavaScript variables you don’t see any information or data as you do when debugging VB.NET or C# code. While you can typically use the Autos, Locals, Watch, or Immediate windows to access the variable data, you can also try highlighting the variable with the cursor and then hovering over the highlighted text with the cursor to see the data contained within the variable. This trick doesn’t work in every situation but is a good one to keep in mind. |
You can also start a debug session directly in Visual Studio .NET 2005 much as you would when debugging VB.NET or C# code within an ASP.NET page. First, right-click the page you’d like to debug in the Solution Explorer and select Set As Start Page from the menu. Then press F5 or click the green play but-ton (the button with the green arrow on it) on the debug toolbar to start Internet Explorer and display the page. Set your breakpoints in the separate script files and then trigger the breakpoints by performing the action you’d like to debug in the browser.
As you step through code, you have full access to standard debug windows such as the Autos, Locals, Watch, and Immediate as shown in Figure 9-12. By using these windows, you can quickly access variable data and drill down into your applications to see what is happening internally.

Figure 9-12
| Tip | Although this section focuses on debugging features in Visual Studio .NET 2005, Visual Web Developer 2005 Express also has integrated debugging features that can be used to debug ASP.NET AJAX applications. While not as full-featured as the Visual Studio .NET 2005 debugger, it does have support for the Script Explorer, Locals, and Watch windows as well as several others. |
EAN: 2147483647
Pages: 107