Debugging with Firefox and Firebug
Although Internet Explorer is still the most widely used browser according to statistics available at the time this chapter is being written, Mozilla Firefox has made significant inroads and is being used by more and more people. As a result, you’ll likely need to debug your ASP.NET AJAX applications in Firefox as well as Internet Explorer. Firefox doesn’t offer any direct integration with Visual Studio .NET, unfortunately, but it does have extensions that can be downloaded and installed that make it rather straightforward to debug ASP.NET AJAX applications.
One of the most popular debugging extensions available for Firefox 1.5 or higher is Firebug. You can download Firebug from the extensions library located at https://addons.mozilla.org/ firefox/extensions. Type “Firebug” in the search box, and you should quickly find it and be able to click the Install Now button to add it to your browser extensions.
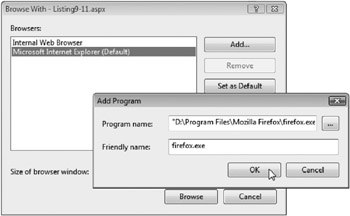
Once installed, Firebug allows you to view the Document Object Model (DOM) of a page, view CSS details, and perform various debugging operations. You can view a page directly in Firefox from Visual Studio .NET by right-clicking the page in the Solution Explorer and selecting Browse With from the menu. The Browse With dialog box will appear. Click the Add button to view the Add Program dialog box as shown in Figure 9-15, and locate where firefox.exe was installed on your computer. Once the program is added into the list of available browsers, you can select it and hit the Browse button to view any page directly in Firefox instead of in Internet Explorer.

Figure 9-15
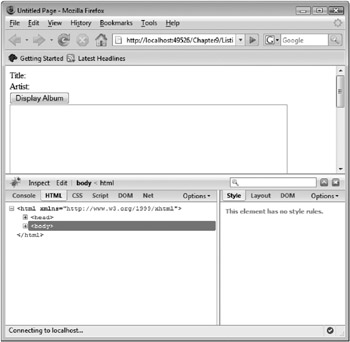
Once a page is loaded in Firefox, you can access Firebug functionality in several ways. First, you can go to Firefox’s Tools menu and select Firebug![]() Open Firebug from the menu (or use the Ctrl+Shift+L hotkey). You can also add a call to Sys.Debug.fail in your JavaScript code. When the fail function is called, Firebug will automatically appear at the bottom of the browser and allow you to step through the code line by line. Figure 9-16 shows what Firebug looks like. You’ll notice that it has several different tabs that allow access to scripts, HTML, DOM elements, and CSS.
Open Firebug from the menu (or use the Ctrl+Shift+L hotkey). You can also add a call to Sys.Debug.fail in your JavaScript code. When the fail function is called, Firebug will automatically appear at the bottom of the browser and allow you to step through the code line by line. Figure 9-16 shows what Firebug looks like. You’ll notice that it has several different tabs that allow access to scripts, HTML, DOM elements, and CSS.

Figure 9-16
It’s quick and easy to get started with Firebug. All scripts loaded in a page are easily accessible without additional effort. When a script is needed by Firebug, its source code will automatically appear in the Script window. Variables within client-script files are accessible through the Console window (which acts much like Visual Studio .NET’s Command window) and in the Script window. HTML code, styles, and other DOM features can be accessed in their respective windows.
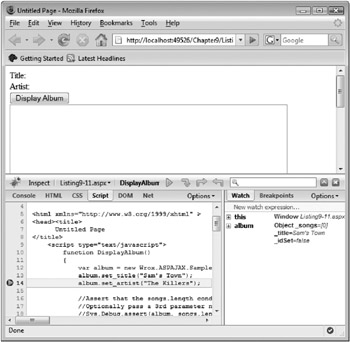
Figure 9-17 shows an example of the Script window during a debug session. Notice that several buttons located in the top of the Firebug toolbar are available for stepping into, stepping over, and stepping out of code. Breakpoints can be set by clicking in the grey tray area where the line numbers are shown. As code is being debugged, the value of the variables currently in scope are displayed to the right of the Script window, allowing you to easily access properties and their associated values. For example, Figure 9-17 shows information for a variable named album.

Figure 9-17
Firebug makes it easy to walk through client scripts and is also useful for inspecting HTML code. It can also come in handy when you need to look at how CSS styles are being applied to different elements in a page.
EAN: 2147483647
Pages: 107