Viewing ASP.NET AJAX Request and Response Messages
Once you’ve ironed out all of the bugs in an ASP.NET AJAX Application, you’ll probably want to perform other types of tests to ensure that the application performs as expected. It’s difficult to know how an application truly performs unless you take the time to look at some of the request and response messages being sent from the client to the server. By looking at the raw message data, you may discover ways to minimize the size of the messages and speed up the request/response mechanism. It’s also important to see the actual request and response because this is a 100-percent authoritative view of what communication is actually taking place between the browser and web server; if this appears different from what you intended, it can alert you to bugs.
Several free and easy-to-use tools exist for inspecting request and response messages. The next sections introduce several such tools, including Fiddler and the Web Developer Helper.
Using Fiddler to Inspect Messages
Fiddler is an excellent tool created by Microsoft’s Eric Lawrence that can be used to inspect AJAX messages exchanged between the client and server. It can be downloaded from http://www.fiddler-tool.com and is free to use. It provides a simple and effective way to view many different details about messages, including request and response headers, raw message data, message sizes, and other useful information.
After Fiddler is installed, it can be accessed directly from the Internet Explorer Tools menu or loaded from the Windows Start![]() Programs menu. During installation, Fiddler registers itself with Internet Explorer by setting itself up as a proxy. Requests for 127.0.0.1 (localhost) are automatically routed to port 8888, which Fiddler listens on. All requests made from the browser will automatically show up in the Fiddler HTTP Sessions list, as shown in Figure 9-18.
Programs menu. During installation, Fiddler registers itself with Internet Explorer by setting itself up as a proxy. Requests for 127.0.0.1 (localhost) are automatically routed to port 8888, which Fiddler listens on. All requests made from the browser will automatically show up in the Fiddler HTTP Sessions list, as shown in Figure 9-18.
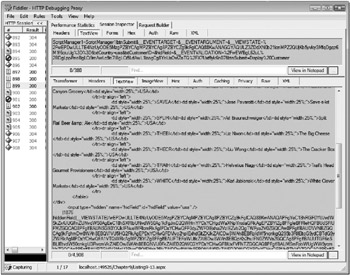
Figure 9-18
Fiddler can be useful when you want to see the overhead involved with using automated versus manual AJAX updates, such as the difference between using an UpdatePanel and using pure JavaScript or XML Script calls. While the UpdatePanel is easier to use, it typically has a larger message payload than equivalent calls made with JavaScript or XML Script. For example, the code shown in Listing 9-13 uses the UpdatePanel to load customer data into a GridView control based upon a country or a customer ID that the end user types into textboxes. Using Fiddler, it’s easy to see exactly what data is passed to the server as well as what data is passed back in the response message.
Listing 9-13
<asp:UpdatePanel runat="server"> <ContentTemplate> <asp:GridView runat="Server" Width="96%" GridLines="none" ShowHeader="false" AutoGenerateColumns="false"> <RowStyle HorizontalAlign="left" /> <Columns> <asp:BoundField ItemStyle-Width="25%" DataField="CustomerID" /> <asp:BoundField ItemStyle-Width="25%" DataField="ContactName" /> <asp:BoundField ItemStyle-Width="25%" DataField="CompanyName" /> <asp:BoundField ItemStyle-Width="25%" DataField="Country" /> </Columns> </asp:GridView> <asp:HiddenField runat="server" /> </ContentTemplate> <Triggers> <asp:AsyncPostBackTrigger Control EventName="Click" /> <asp:AsyncPostBackTrigger Control EventName="Click" /> </Triggers> </asp:UpdatePanel> Using Fiddler, you can inspect the messages being sent as the UpdatePanel is triggered and refreshed. Figure 9-19 shows what the different messages look like in Fiddler using the Session Inspector tab. The top pane in the figure shows the request message, while the bottom pane shows the response message. Although the request message is fairly small, you can see that the response message is relatively large. It contains all of the data that will be updated in the GridView control as well as ViewState information and other details. If ViewState is not needed, it can be turned off, which will significantly reduce the size of the UpdatePanel’s response message. In this example, the response message size can be reduced from 4,908 characters to 3,106 by turning off ViewState on the GridView control.

Figure 9-19
| Tip | If you try to view Listing9-13.aspx using Visual Studio .NET 2005’s built-in Web server, you may notice that the request and response messages do not show up in Fiddler. To see the request and response messages in Fiddler, add a period (.) character immediately after localhost (but before the colon and port number) in the browser. For example, the following URL will show up in Fiddler prop-erly (notice the”.“ after localhost): http://localhost.:49526/Chapter9/Listing9-13.aspx. |
The code in Listing 9-14 performs the same task shown earlier with the UpdatePanel but does it using pure JavaScript calls and a ListView control defined using XML Script (part of the ASP.NET AJAX Futures at the time this chapter was written). Running Fiddler to track messages results in a response message size of only 1,730 characters, as shown in Figure 9-20. The request and response messages are significantly smaller because the JSON objects sent to and from the server are much more compact compared to sending HTML, ViewState, and other data.
Listing 9-14
function GetCustomerByCountry() { var country = document.getElementById("txtCountry").value; //Call Web Service Wrox.ASPAJAX.Samples.CustomersService.GetCustomersByCountry(country, OnWSRequestComplete); } function GetCustomerByID() { var custID = document.getElementById("txtCustomerID").value; Wrox.ASPAJAX.Samples.CustomersService.GetCustomersByID(custID, OnWSRequestComplete); } function OnWSRequestComplete(results) { var listView = $find("searchResults"); if (listView != null) { listView.set_data(results); } GetMap(results); } 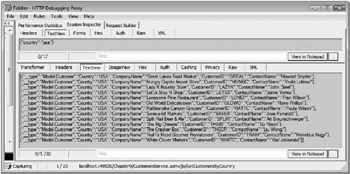
Figure 9-20
There’s much more to Fiddler than can be discussed in this chapter. However, you’ve seen the fundamentals on how it can be used to view request and response messages so that you can locate data errors and compare techniques of sending request and response messages.
Using Web Development Helper to Inspect Messages
Fiddler isn’t the only tool that can be used to view ASP.NET AJAX request and response messages. Another great tool is the Web Development Helper. Web Development Helper is written by Nikhil Kothari, one of the key ASP.NET architects at Microsoft. It’s an excellent tool that can perform a variety of tasks such as viewing HTTP requests and responses, debugging scripts, and viewing the DOM of a page. You can download the tool at http://projects.nikhilk.net/Projects/ WebDevHelper.aspx.
Once installed, the tool is accessible directly in Internet Explorer by selecting Tools![]() Web Development Helper from the menu. The tool loads directly into Internet Explorer, which makes it easy to access and use. Figure 9-21 shows what the Web Development Helper tool looks like while running within Internet Explorer.
Web Development Helper from the menu. The tool loads directly into Internet Explorer, which makes it easy to access and use. Figure 9-21 shows what the Web Development Helper tool looks like while running within Internet Explorer.
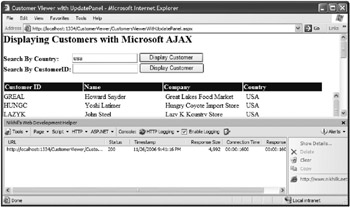
Figure 9-21
To inspect request and response messages you can click the Enable Logging check box on the Web Development Helper toolbar. All messages sent or received using localhost will automatically be logged, along with the status code and response message size. Double-clicking a logged message allows you to see the request and response headers as well as all of the content within the individual messages. Figure 9-22 shows an example of using the Web Development Helper to view an UpdatePanel request and response. Response messages can be viewed in Partial Rendering mode (shown in Figure 9-22), in raw text mode, or in a Hex mode. Partial Rendering mode is especially useful because it parses the raw response message and makes it easy to view controls that trigger asynchronous postbacks, child UpdatePanel IDs, hiddenFields (ViewState and so on), as well as UpdatePanel response data.
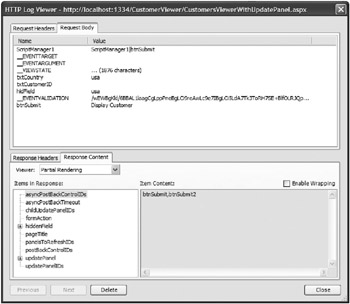
Figure 9-22
Web Development Helper allows you to apply filters to limit the types of HTTP requests it monitors. You can access the filtering options by going to Tools![]() Options
Options![]() HTTP Logging on the Web Development Helper toolbar. If you’d only like to monitor requests made to .aspx and .asmx files, you can type .aspx,.asmx into the Logging Filter textbox to filter out all other types of requests.
HTTP Logging on the Web Development Helper toolbar. If you’d only like to monitor requests made to .aspx and .asmx files, you can type .aspx,.asmx into the Logging Filter textbox to filter out all other types of requests.
EAN: 2147483647
Pages: 107