4. Traditional Discriminant Analysis
4. Traditional Discriminant Analysis
A unified way of looking at the above algorithms is to analyze them from the feature space transformation point of view: indeed, the feature-weighting scheme (e.g., [35]) is the simplified diagonal form of a linear transformation in the original feature space, assuming feature independence. Mahalanobis distance or generalized (or weighted) Euclidean distance using the inverse of the covariance matrix of the positive examples ([11], [12]) is a whitening transformation based on the configuration of the positive examples, assuming Gaussian distribution.
From the pattern classification point of view, when only positive examples are to be considered and with Gaussian assumption, the whitening transformation is the optimal choice [43]. When both positive and negative examples are to be considered—instead of the aforementioned various, seemingly plausible heuristics for feature-weighting—two optimal linear transformations based on the traditional discriminant analysis are worth investigating. Of course, the "optimality" depends on the choice of objective function; in this sense, it becomes a problem of formulating the best objective function.
4.1 Two-Class Assumption
One approach is the two-class fisher discriminant analysis (FDA). The objective is to find a lower-dimensional space in which the ratio of between-class scatter over within-class scatter is maximized.
| (30.1) | 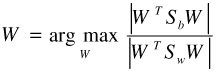 |
where
| (30.2) |
| (30.3) |
We use {xi, i = 1, …, Nx} to denote the positive examples, and {yi, i = 1, …, Ny} to denote the negative examples. mx, my, and m are the mean vectors of the sets {xi}, {yi}, and {xi}∪{yi}, respectively. (See [43] for details.)
For this two-class discriminant analysis, it is part of the objective that negative examples shall cluster in the discriminating subspace. This is an unnecessary and potentially damaging requirement since the relatively small training sample is a not good representative for the overall population, especially the negative examples. Plus, very likely the negative examples will belong to multiple classes. Therefore the effort of rounding up all the negative examples can mislead the resulting discriminating subspace into the wrong direction.
4.2 Multiclass Assumption
Another choice is the multiple discriminant analysis (MDA) [43], where each negative example is treated as from a different class. It becomes an (Ny+ 1)-class discriminant analysis problem. The reason for the crude assumption on the number of negative classes is that the class labels within the negative examples are not available. One may suggest that the user shall provide this information. However, from a user interface design point of view, it is reasonable for the user to click to indicate items as relevant versus irrelevant (say, "horses" and "nonhorses"), but troublesome and unnatural for the user to further identify for the machine what the negative items really are ("these are tigers, those are zebras, and that is a table…").
For MDA the objective function has the same format as in Equation (30.1). The difference is in the definitions of the scatter matrices:
| (30.4) | 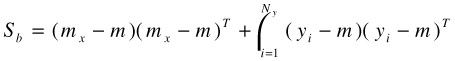 |
| (30.5) | 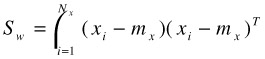 |
In this setting, it is part of the objective that all negative examples shall be apart from one another in the discriminating subspace. This is again an unnecessary and potentially damaging requirement since there are cases in which several negative examples come from the same class. The effort of splitting them up can lead the resulting discriminating subspace into the wrong direction.
4.3 Dimensionality Reduction Matrix
For both FDA and MDA, the columns of the optimal W are the generalized eigenvector(s) wi associated with the largest eigenvalue(s) λ, i.e.,
| (30.6) |
The traditional discriminating dimensionality reduction matrix, formed by the k eigenvectors associated with the top k eigenvalues, is defined as
| (30.7) |
In the new space xnew = ATxold, the following "actions" are employed to ensure the optimal ratio in Equation (30.1): for FDA, the positive centroid is "pushed" apart from the negative centroid, while examples of the same label are "pulled" closer to one another; for MDA, the positive centroid and every negative example are "pushed" apart from one another, while positive examples are "pulled" closer to one another.
Note that the effective dimension of the new space is independent of the original dimensionality. Specifically, for FDA, since the rank of Sb is only one, the discriminating subspace has one dimension. For MDA, the effective new dimension is at most min{Nx, Ny}. However, after regularization (see Section 5.3) these can be artificially higher.
EAN: 2147483647
Pages: 393