Using the ColdFusion Debugging Options
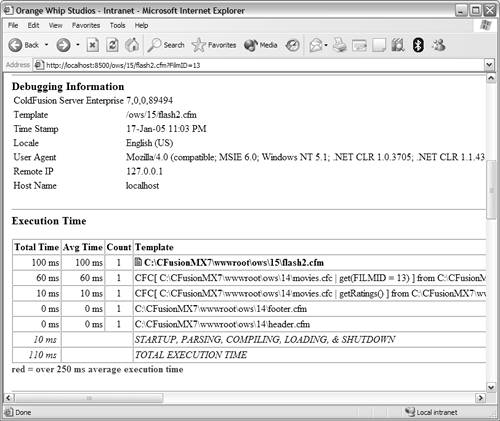
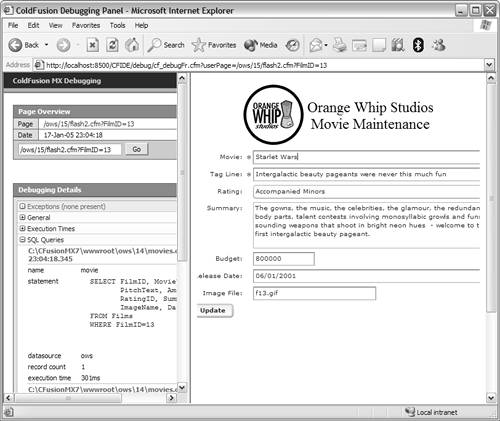
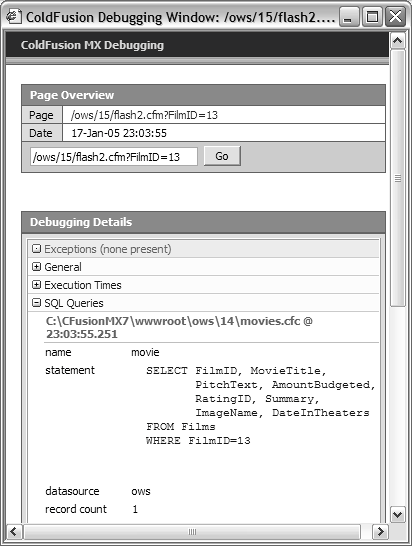
| The ColdFusion debugging options are enabled or disabled via the ColdFusion Administrator, as explained in Chapter 3, "Accessing the ColdFusion Administrator." TIP You can restrict the display of debugging information to specific IP addresses. If you enable debugging, you should use this feature to prevent debugging screens from being displayed to your site's visitors. CAUTION At a minimum, the local host IP address (127.0.0.1) should be specified. If no IP address is in the list, debugging information will be sent to anyone who browses any ColdFusion page. ColdFusion supports three different debugging modes. They all provide the same basic functionality, but with different interfaces. Classic DebuggingThe classic debugging interface appends debugging information to the end of any generated Web pages, as shown in Figure 17.7. The advantage of this format is that it doesn't use any complex client-side technology, so it's safer to use on a wide variety of browsers. Figure 17.7. ColdFusion can append debugging information to any generated Web page. To select this option, select classic.cfm as the debug format in the ColdFusion Administrator. NOTE This is known as the classic format because it's the format supported in ColdFusion since the very first versions of the product. Dockable DebuggingColdFusion also features a powerful DHTML-based debugging interface. As seen in Figure 17.8, debug information is displayed in a tree control in a separate pop-up window, or docked to the output itself, as seen in Figure 17.9. The advantage of this format (aside from a much cleaner and easier-to-use interface) is that the debug output doesn't interfere with the page itself. Figure 17.8. ColdFusion debug output can be displayed in a pop-up DHTML based window.
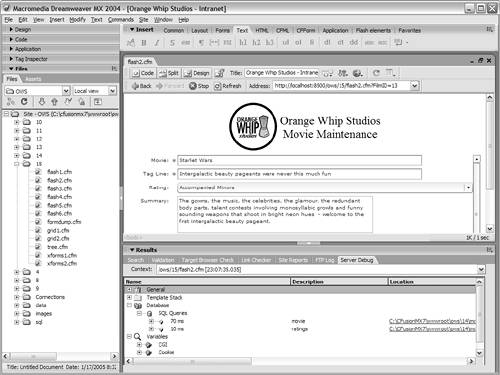
Figure 17.9. Debug output may be "docked" to the page, if preferred. To select this option, select dockable.cfm as the debug format in the ColdFusion Administrator. Dreamweaver DebuggingDebug output is also accessible from within Dreamweaver itself, as seen in Figure 17.10. Any ColdFusion page can be debugged from within Dreamweaver by clicking the Server Debug button on top of the Dreamweaver editor window, or selecting Server Debug from the View menu. Debug output is displayed in the Results panel below in a tree format. Figure 17.10. Within Dreamweaver, ColdFusion debug output is displayed in the Results panel. Using Debugging OptionsRegardless of how the debugging information is accessed (through any of the options just listed) you'll have access to the same information:
As you move from page to page within your application, the debug output will provide insight into what's actually going on within your code. NOTE The exact information displayed in debug output is managed by options in the ColdFusion Administrator. Using TracingIn addition to all the invaluable information provided by the debugger, you may on occasion want to generate your own debug output. For example, you may want to:
This kind of information is useful in debugging logic problemsthose annoying situations where code is valid syntactically, but some logic flaw (or unexpected situation) is preventing it from functioning correctly. To insert your own information in debug output, use the <cftrace> tag, which embeds trace information. <cftrace> takes a series of attributes (all optional) that let you dump variable contents, display text (dynamic or static), abort processing, and more. As seen in Figure 17.11, the generated trace output is included with the standard debug output (if that option is enabled in the ColdFusion Administrator). Figure 17.11. Trace output (generated using <CFTRACE>) is included with debug output.
To use <cftrace>, simply embed <cftrace> tags at strategic locations in your code. For example, if you're trying to figure out why variables are being set to specific values, use <cftrace> statements at the top of the page, before and after any <cfinclude> statements and any other statements that could set variable values, and so on. To output simple text use the following <cftrace> syntax: <cftrace text="Just before the cfinclude"> To display variable values, you could do the following: <cftrace text="firstname at top of page" var="firstname"> Additional <cftrace> attributes allow for message categorization and prioritization, but the two examples here are usually all you need. By embedding <cftrace> blocks in your code you'll get a clear and systematic view into what happened, when, and why. |
EAN: N/A
Pages: 282

