On-Report Analysis
| Users are expected to use Web Intelligence to explore data, create reports, and then publish those reports for others to see and analyze. Often there are many more users who consume existing reports than users who author reports. However, for this large number of users, there are various report interaction levels that might be desired or allowed by the application administrator. To accommodate different levels of interactivity, Web Intelligence documents can be viewed in three default formats: PDF, which renders them almost totally static; HTML, which provides a little more interactivity; and interactive, which provides the full breadth of analysis and formatting available. Table 20.4 compares the three formats.
The next section focuses on the capabilities of viewing Web Intelligence documents in Interactive mode. Viewing a Document in Interactive ModeFigure 20.7 is a screenshot of a report created on the eFashion universe as seen in Interactive mode. The query contains the objects seen in the WebI Query HTML panel example (refer to Figure 20.6) with two levels in the scope of analysis. The left pane of InfoView that shows the folders has been hidden to provide more screen space for the report. Figure 20.7. A Web Intelligence report open in Interactive mode.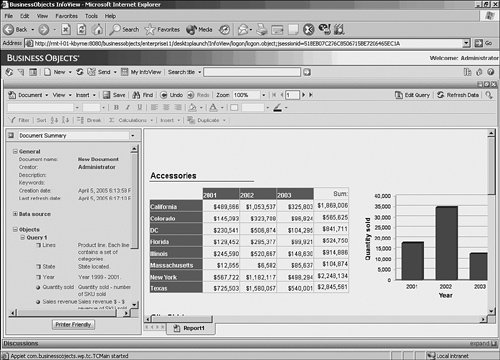 In Figure 20.8, you will first notice that the left side of the screen has a pane with a drop-down list. This pane contains metadata about the report. For example, in the document summary currently seen, a user unfamiliar with the report can learn a great deal about the origin and content of the report. Most notable are the prompts requested and the values selected for the report. This report contains data for the years 2001 through 2003, and data for a long list of clothing lines. So if there is ambiguity about the content of the report, a business user can look at the description and see exactly what objects and conditions were used in gathering the data. Also, an important attribute is the last refresh time, letting the user know if the information is fresh. Figure 20.8. Document summary in WebI left pane.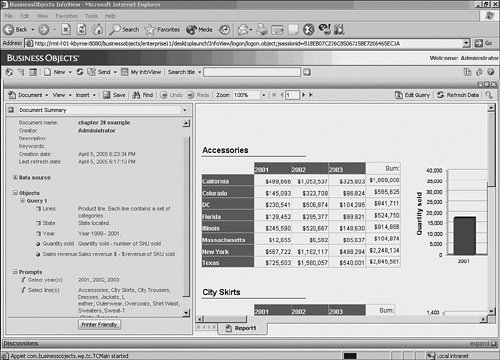 In the Data Summary, the objects are selected and their associated descriptions (defined in the semantic layer) are displayed. You can also see the universes used for each query. The left pane contains a number of drop-down boxes to help orient the user to the content and layout of the report, as well as to aid in navigating the report via the navigation map. The navigation map provides a navigation tree starting with each report tab, and shows each underlying section and subsection defined within the report. When the user clicks on the section, the screen moves to this section of the report, as depicted in the cross-tab table reflecting the Leather line in Figure 20.9. Figure 20.9. Navigation map with leather selected; report moves to leather section.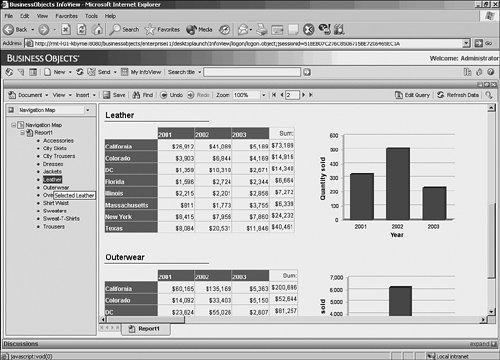 A user can also change the prompt values by going to the User Prompt Input drop-down menu and manually editing the dialogs for each prompt, or she could achieve the same result by refreshing the report by clicking on the Refresh Data button in the top-right corner, which brings up the Prompts dialog with the previous refresh values, as seen in Figure 20.10. Figure 20.10. A WebI report showing the User Prompt Input in the left pane. The report was refreshed and the Prompt dialog shows the previously selected values.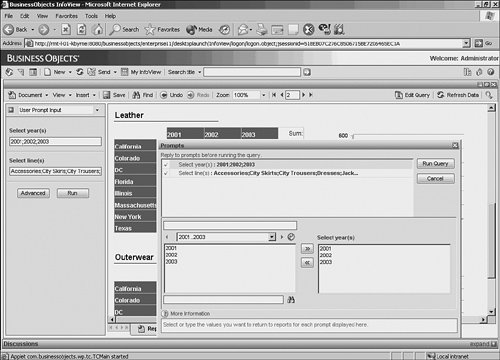 The user can also search for text within the report via the Find drop-down menu. The search does a partial string search unless full word is specified; the case can also be specified, as well as the direction of the search. ToolbarsNotice the toolbars available for report analysis and formatting. These toolbars closely mimic the toolbars available in the Business Objects desktop reporting tool, so they should be familiar to Business Objects users. They provide access to report formatting, report manipulation, and formula creation functions. Also note that the standard Microsoft button icons are used whenever possible for ease of adoption by end users. Some of the capabilities are discussed in the next subheadings. Data ManipulationThe most common activities users request are sorting and filtering of data on the report. Both are easily achievable by choosing the Sort and Filter buttons. The user can also right-click on the report to bring up a context-sensitive menu that accesses the same function calls. For example, if the user wants to filter the data in the sample report to show California, Colorado, and Texas only, she could right-click on the States column on the report and that would bring up the context-sensitive analysis menu, as seen in Figure 20.11. Figure 20.11. The cross-tab table with State highlighted and the context-sensitive menu open, with Quick Filter highlighted.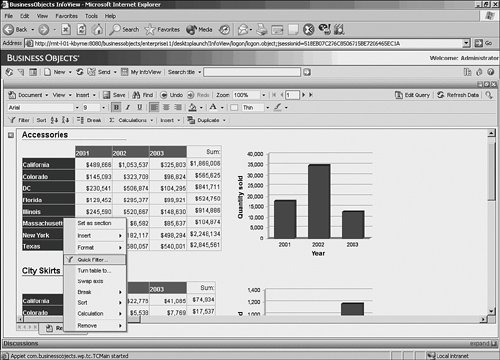 Choosing the Quick Filter option brings up a dialog for the object showing all of the possible values that exist in the report. The user can select the ones she wants and choose OK; the report is instantly filtered with the values. Figure 20.12 shows the Quick Filter dialog with some states selected. Figure 20.12. The Quick Filter dialog with some states selected.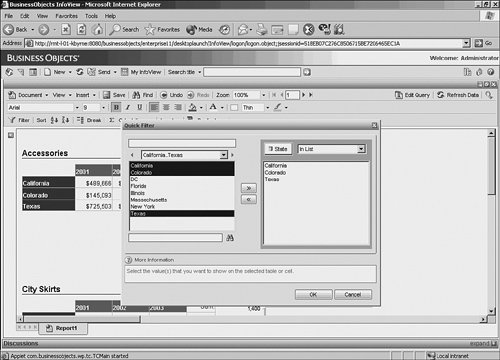 Figure 20.13 shows the result of applying the filter on State. The filter was applied to the cross-tab table and not the chart, so the values were filtered by report block. This underscores that the report block is showing a particular intersection of the microcube beneath it, and each report block can function independently of the other, or can be synchronized to reflect common filtering during drill-down analysis (more on this later). Although this is a complicated technical concept, to a business user this makes intuitive sense; the chart is a different presentation than the cross-tab and therefore follows different filtering rules, unless it is explicitly told to follow the same rules. Note that this shows considerable difference from the banded report writing approach seen in Crystal Reports. Figure 20.13. The report with the filter applied; only the selected values appear in the report. The data dynamically recalculates to accommodate the filter.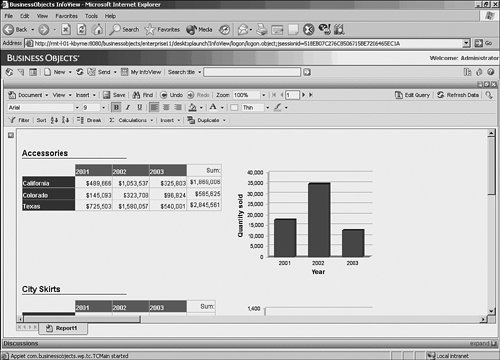 Suppose that the user wants to sort these rows descending alphabetically. The user can simply click on the values (click directly in one of the cells) and then just click on the Descending Sort button on the toolbar, and the results are instantly sorted. More than one column can be sorted and sorts occur in the order applied. The left pane in Figure 20.14 now shows the Document Structures and Filters view. This shows that at the report level, the Year and Line filters apply to the entire document. It also shows that the cross-tab has a filter on State and the values of that filter. It shows that there are no filters applied to the bar chartagain, all this metadata is useful for the business user when determining exactly what makes up the results in the report. Figure 20.14. The Document Structure and Filters view is in the left pane. Notice that the query filters are applied globally, but the State filter is applied to the cross-tab block only and not to the bar chart. Pivoting and Swapping ObjectsImagine that the user would like to swap the axes within the cross-tab, showing states across the top and years down the side. The easiest way is to just drag and drop the row or column names directly on the report. Another way that shows a bit more of the internals of the reporting engine is achieved by right-clicking on the report to bring up the context-sensitive menu and by then choosing Format/Table. The following dialog appears as shown in Figure 20.15, the last tab of which is labeled Pivot. Figure 20.15. The Format Table dialog with the Pivot tab highlighted. Objects can be moved to change the values of the cross-tab. Objects can be chosen from any in the Available Objects pane or can be swapped from within the rows and columns boxes by dragging and dropping.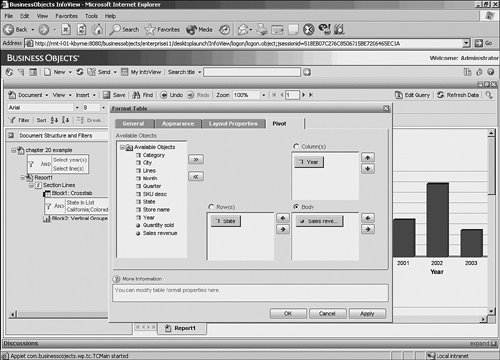 The dialog displays the objects in the cross-tab configuration. The objects can then be dragged from the Row area to the Column area and vice versa, thus swapping the columns and rows. Note too that all other objects in the report are available on the left side, so completely different objects could be put into the cross-tab, or all of the objects completely replaced with a new selection. Likewise, report variables could be used as well (more on how to create report variables in the next subheading). So the reports can be completely redesigned by the end user, all through the Interactive mode, with no trip back to the query panel. This allows report designers to give the users maximum analytic flexibility while further shielding them from the database. Because reports can function as containers of predefined finite resultsets, the users can pick the reports and manipulate and analyze them in myriad ways without going back to IT for report refinement. Figure 20.16 shows the result of the pivot. Figure 20.16. The axes are swapped, along with sums.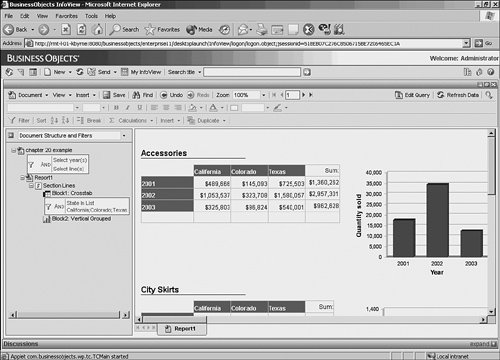 Note You could have more easily chosen Swap Axis from the context-sensitive menu, but then you would not have been able to see the ability to move objects in and out of the cross-tab. In Web Intelligence there are often several ways to accomplish the same thing. Just as in Microsoft Word, where a user can select text to copy and press Ctrl-C, click on the Copy button, or choose Copy from the Edit menu, so, too, in Web Intelligence users can choose one of several ways to manipulate the interface that is more compatible with their computing style. |
EAN: 2147483647
Pages: 365
- Challenging the Unpredictable: Changeable Order Management Systems
- The Second Wave ERP Market: An Australian Viewpoint
- Context Management of ERP Processes in Virtual Communities
- Intrinsic and Contextual Data Quality: The Effect of Media and Personal Involvement
- Relevance and Micro-Relevance for the Professional as Determinants of IT-Diffusion and IT-Use in Healthcare