Report Anatomy
| Note The universe that ships with Business Objects XI cannot adequately demonstrate the capabilities outlined in this chapter. Therefore, all examples in this chapter are drawn from two universes that are readily available and shipped with Web Intelligence 6.5.1. The universes are called eFashion and Island Resorts, and are sourced off of Microsoft Access databases. These universes, along with instructions for putting them into the XI infrastructure are available on this book's website. Note that because there is no change in universe file format, all existing Business Objects universes are fully functional via Web Intelligence inside the XI framework. As mentioned in the preceding section, Web Intelligence reports are not banded as they are in Crystal Reports, but they consider the innermost band or Details section of a Crystal Report to contain a WebI report block. The report block is a projection of the data in the microcube. As such, it does not necessarily represent the atomic level of data in the report resultset. For example, if a query is run that selects Year, Quarter, Month, and Sales Revenue, the report block could show only Year and Sales Revenue. Although the data for all four objects is contained within the report, the user sees the projection based only on the objects displayed in the report block. In this case, the Sales Revenue numbers would be automatically rolled up to the year level, and only one record per year would exist in the report block. In Web Intelligence, the report designer or user is generally more interested in seeing the data at some level of aggregation (projection) in which her analysis starts, so often times the projection is quite high up in the data hierarchy. This is because a user will interact with the report and drill down into the level necessary when using the report. This also means that the report contains other data elements besides just the values shown, as is evidenced in Figure 20.2. Figure 20.2. Web Intelligence report with simple table and resultset objects in left pane.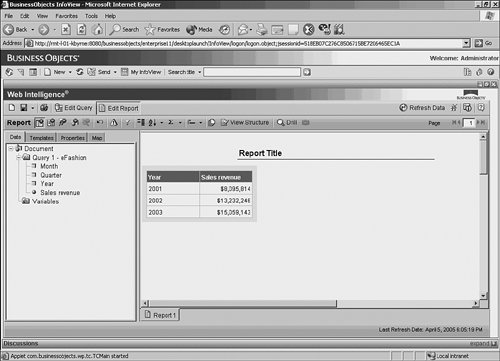 Figure 20.2 shows objects contained in the resultset on the left, and the report block on the right. Clearly, data exists in the report for each month, but when seen in the report block on the right, the data is projected at the year level. When objects are placed into the report block from the left side, the report block automatically recalculates the projection for the proper combination of dimensions. There are different kinds of block types, which are discussed in the next subheading. All are interactive and allow for drilling into detail. Creating ReportsIn Web Intelligence, a report is created using a report panel. This is often referred to as the query panel, and the terms are interchangeable. Three report/query panels are available:
Note Really, the Java Report Panel and the HTML Report Panel are both query and report panels because they provide the capability to both generate the query and do report formatting. The Query HTML is a true query-only panel because no report formatting is available through this interface. It is intended for use with the On-Report analysis feature to provide for a totally thin query and report formatting solution. The Web Intelligence HTML report panel was a first generation totally thin reporting solution. It is being supplanted by the Web Intelligence Query HTML query panel in combination with the on-report analysis features. This paradigm is more akin to the original and highly successful report query and formatting paradigm of the Business Objects desktop product with which the majority of existing customers are already familiar. The Web Intelligence HTML report panel is not discussed in this book. A report created in one query panel can be opened in another. A report created in the Java report panel could be opened in the HTML report panel. Not all functionality is exposed within each tool, so it might not be feasible to do all functions in each report panel. However, because all solutions are built off of the same underlying object model, the functionality exists even if not exposed through the interface. The query/report panels will be enhanced to bring them to parity in future releases. Prior to the XI release, people often chose to use the Web Intelligence Java report panel. With the XI release, it is anticipated that a significant number of users will use the Web Intelligence Query HTML and the on-report analysis features instead of the Java report panel. Web Intelligence Java Report PanelThe Web Intelligence Java report panel (henceforth referred to as the Java report panel) will open when the user's preferences are set to this option in the Preferences section of InfoView and after a user chooses a universe for building a query. Figure 20.3 shows the Web Intelligence Java report panel with the eFashion universe opened. The Year object was selected from the Time Period class and is in the midst of being dragged and dropped into the result objects pane. Objects can be moved to any of the panes on the right side of the window. Note the help text in the panes telling the user how to use each pane. Figure 20.3. The Web Intelligence Java report panel.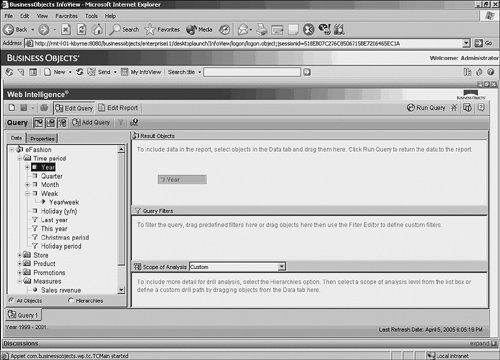 The window is broken into panes. On the left side is the data pane that contains the universe objects. As you can see in Table 20.3, there are four different object types.
Users drag and drop objects from the left pane to the various right panes. Objects put in the result objects pane show up in the report block by default during the fist execution. Objects put in the query filters pane do not show up in the resultset unless a corresponding object is in the result objects pane. Rather, these objects restrict the query (WHERE, HAVING, or subselect clauses), depending on how the filters are constructed. The objects in the scope of analysis pane are included in the query, but are not seen directly in the report block. So this is extra data contained within the report, but not displayed until required. Note Scope of analysis refers to the inclusion of objects in an object hierarchy. For example, a common hierarchy is TimeYear, Quarter, Month, Week, Day, and so forth. If the Year object is chosen as a result object and then the scope of analysis is set to two levels, the next two levels of the time hierarchy are also added to the query (Quarter, Month). Consequently, if Quarter had been chosen in the result objects pane instead of Year and the scope of analysis was set at two levels, the Month and Week objects would be added to the query. The scope of analysis brings in the number of levels specified below the object named in the result object pane. If multiple dimensions belong to hierarchies, all hierarchies are included in the scope of analysis. This will be discussed more in the "Drilling" section later in this chapter. The interface is fairly simplepull over the objects you want in the query and press the Run Query button in the top right. The user can use the Condition objects (yellow funnel icons) to place restrictions on the query, or he can build his own filters. If objects are dragged into the query filters pane, the left pane automatically changes to walk the user through the filter creation process. Figure 20.4 shows creation of a filter on the Lines object. Figure 20.4. When the Lines object is dropped into the Query Filters pane, the Filter Editor dialog immediately opens to walk the user through the filter creation process.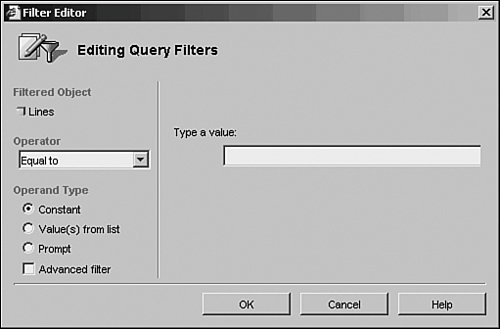 In Figure 20.4, the Lines object has been selected to be filtered, as is indicated in the top left of the Filter Editor dialog. A list of operators is available via a dropdown menu. You can also select an operand type. The operators are common functions, such as Equal To, Different From, In List, Not in List, Between, Is Null, and so forth. The operand types tell how the variables should be handled. The report author can enter a constant value, he can choose the values from a pick list, or he can create a prompt so that in subsequent runs of the report, the user can enter different parameters. The right side of the dialog changes context, depending on the operator and operand type chosen. Additionally, the user can choose the Advanced Filter check box. This is the mechanism for putting specific types of subqueries into a query. Discussion of this feature is beyond the scope of this chapter, but the Crystal Report author should note that subquery capability exists within the Web Intelligence query panel. If multiple filters are chosen, the filters can be nested, with and/or operators applied. For example, a query could be restricted on all Customers with an Order level less than 20,000 last year or Customers with an Order level less than 10,000 this year, and, either way, exclude all Customers from Texas. Keeping in mind that the objects themselves can contain quite sophisticated SQL (such as CASE statements or complex formulas), and understanding how objects can be put together in any combination in the query panel, you can see that sophisticated SQL can be generated by a business user without him knowing any of the underlying database structures or SQL syntax. For those users who might be more familiar with database structures and SQL, there is a Show SQL button that presents the user with the SQL generated from the query panel. As previously mentioned, this application feature is securable via the CMC, so it can be turned off to avoid exposing the database layer to specific users. However, it is a valuable tool for support staff helping to troubleshoot queries when business users run into complications. Within the Java report panel is an Add Query button. This button enables multiple queries to be generated within a single report. This means that data from multiple and disparate databases can be brought together within a single Web Intelligence report and presented side-by-side. Web Intelligence Query Panel HTMLThe Web Intelligence Query Panel HTML (henceforth referred to as Query HTML) provides the same functionality described in the preceding section but in a truly thin client. The Query HTML panel is enabled through the preferences in InfoView by choosing Query HTML from the list of report panels. Figure 20.5 shows how to set the Web Intelligence preferences for a user. Figure 20.5. Preferences in InfoView, showing Web Intelligence viewing and report panel preferences.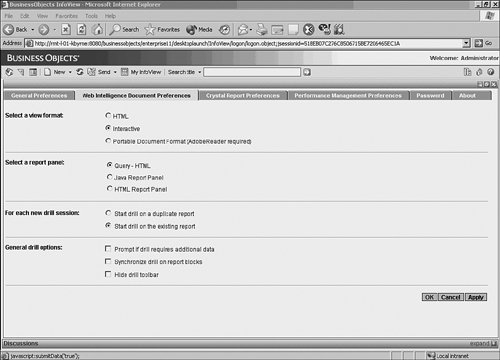 The Query HTML panel can be seen in Figure 20.6. Figure 20.6. The Query HTML panel.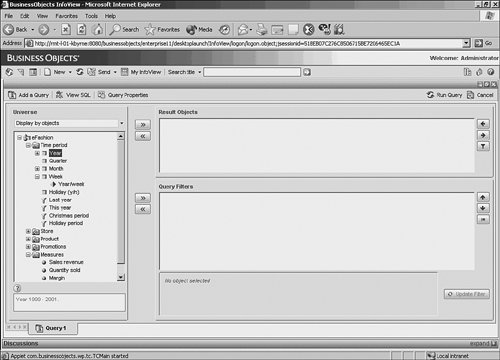 Below are some of the HTML panel features:
There are fewer features in this panel than the Java report panel because it contains no capabilities for report formatting. However, with the exception of the advanced query filters, the panel provides the same query functionality as the Java report panel. As stated previously, reports created with one report panel can be opened with another. So, for example, if a report was created with the Java report panel and it included an advanced query filter, another user could open that report in the Query - HTML panel and edit it and the report would still maintain the advanced query filter (depicted with a blue funnel to distinguish it from a simple filter). The user would not be able to edit the advanced filter, but could remove it or nest it in conjunction with other query filters. Again, all query panels utilize the same underlying object model, so reports are not query-panel dependent. After you develop a report with the Query HTML panel, formatting is the next step. In Web Intelligence, the concept of on-report analysis consists of manipulating the results directly on the HTML by the end user. A key focus of the reporting paradigm is the ability to manipulate a report either newly created via ad-hoc or previously created and published. |
EAN: 2147483647
Pages: 365