| Microsoft promotes Office System 2003 PivotCharts as a substitute for MSGraph OLE Objects for a good (marketing) reason: MSGraph requires a crosstab query or equivalent and, as mentioned earlier, SQL Server's T-SQL doesn't support crosstab queries directly. If you want to add graphs or charts to ADP, PivotCharts are the least-effort answer. The same is true if you anticipate upsizing your Jet databases to SQL Server and upgrading conventional Access objects to ADP forms and reports. The sections that follow describe how to use PivotCharts to emulate the unlinked and linked MSGraph objects you created in the preceding sections of this chapter. The example PivotCharts use the qry1997SalesChart query, because the Jet SQL and T-SQL versions of the query are identical. The PivotTable created from the query acts as the data source for the PivotChart by handling the data restructuring ordinarily accomplished by Jet SQL PIVOT...TRANSFORM statements.  To review PivotChart design basics, see "Formatting and Manipulating PivotCharts," p. 481. To review PivotChart design basics, see "Formatting and Manipulating PivotCharts," p. 481.
Using AutoForm to Create a PivotChart Form PivotCharts don't have the formatting flexibility of MSGraph objects, but they let you duplicate most MSGraph chart types satisfactorily. To generate a stacked area PivotChart based on the qry1997SalesChart query, do the following: Click the Forms shortcut in the Database window, and then click the New button to open the New Form dialog. Select AutoForm: PivotChart in the list, and select the query to serve as the data source for the form. This example uses the qry1997SalesChart query (see Figure 18.32). Click OK to open the PivotChart view of the new form with the Chart Field List superimposed on the empty chart. Figure 18.32. The quickest way to create a PivotChart form is to use the New Form dialog's AutoForm: PivotChart option.  Drag the Amount field from the Chart Field List to the Drop Data Fields Here zone and the CategoryName field to the Drop Series Fields Here zone. Each product category is a member of Series 1 of the PivotChart. Note The PivotChart detects the currency format of the Amount query column and applies standard currency formatting to the y-axis. Unlike MSGraph, you can't remove the two digits after the decimal point without writing a considerable amount of VBA code. Expand the Field List's ShippedDate By Month node and drag the Months field to the Drop CategoryFields Here node. The default chart type is the conventional (not stacked) column version, so Months has one column for each product category (see Figure 18.33). Figure 18.33. Adding value, category (classification), and series fields (columns) from the qry1997SalesChart query generates this default multiple column chart.   Click the Chart Type button to open the Type page of the Properties dialog. Select the Area chart type and click the Stacked Area subtype to emulate the MSGraph chart you created in the "Changing the Graph to a Chart" section early in the chapter (see Figure 18.34). (If the button is disabled, select the chart to enable it.) Click the Chart Type button to open the Type page of the Properties dialog. Select the Area chart type and click the Stacked Area subtype to emulate the MSGraph chart you created in the "Changing the Graph to a Chart" section early in the chapter (see Figure 18.34). (If the button is disabled, select the chart to enable it.)
Figure 18.34. The PivotChart's Stacked Area chart type is almost identical to that of MSGraph 10. Notice that the month abbreviations are centered under instead of between the x-axis value markers. 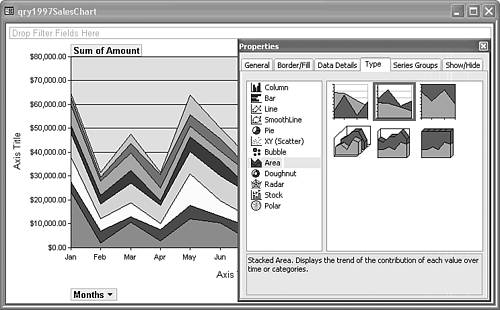 Click the Show/Hide tab and clear all check boxes except Screen Tips and Commands and Options Dialog Box. Removing the field buttons prevents users from rearranging the chart. Note "Commands and Options" was the original name of the Properties dialog. Microsoft's developers overlooked changing the caption of the check box. With the Properties dialog open, click the y-axis line, and then click the Format tab. Change the font size to 9 points, and apply the Bold attribute to the labels. Repeat step 6 for the x-axis labels. Select in the General page's list the Value Axis 1 Title, click the Format tab, and delete its Caption property value. Do the same for the Category Axis 1 Title. Optionally, select the Legend, and change the Position to Bottom. (If the Legend isn't visible, choose PivotChart, Show Legend).    Change to Form Design view, click the Form Selector button, open the Form properties window, click the Format tab, and type 1997 Monthly Sales By Category as the value of the Caption property. Your PivotChart in Form view now appears as shown in Figure 18.35. Change to Form Design view, click the Form Selector button, open the Form properties window, click the Format tab, and type 1997 Monthly Sales By Category as the value of the Caption property. Your PivotChart in Form view now appears as shown in Figure 18.35.
Figure 18.35. With the exception of the two decimal digits of the y-axis labels, this PivotChart successfully emulates the MSGraph stacked area chart shown earlier in Figure 18.16. 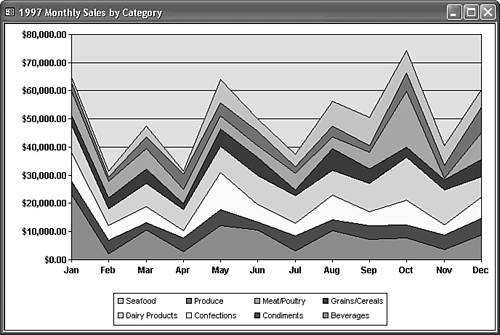 In Form Design view, open the form's Properties window again and set Allow Form View, Allow Datasheet View, and Allow PivotTable View property values to No. Restricting the view of the form is important because it keeps users from being confused by extraneous views of nonmeaningful data. Save your form with a descriptive name, such as sbf1997SalesPivotChart, and close it. You apply the sbf prefix because you use the PivotChart form as subform in the next section.
Note PivotChart forms don't have a Window, Size to Fit Form menu command in Form view. As you change the dimensions of the form, the PivotChart expands or contracts accordingly.
Using the PivotChart Form as a Subform The PivotChart view of a form prevents you from altering the overall design of the form. For instance, you can't add a visible page header/footer or add extra space to the detail section in which to place a label for a chart title. To achieve form layout flexibility, use the PivotChart form as a subform by following these steps:  Click the New Object button and choose Form to open the New Form dialog. Accept the default Design view, leave the table/query list empty, and click OK. Click the New Object button and choose Form to open the New Form dialog. Accept the default Design view, leave the table/query list empty, and click OK.
Expand the Detail section of the form to accommodate a chart or graph of reasonable size, approximately 6.5 inches wide by 4.5 inches deep for this example.   Open the Toolbox, and make sure the Control Wizards button is selected. Open the Toolbox, and make sure the Control Wizards button is selected.
 Select the Subform/Subreport tool, and draw a subform container of moderate size. When you release the mouse, the SubForm Wizard opens. Select the Subform/Subreport tool, and draw a subform container of moderate size. When you release the mouse, the SubForm Wizard opens.
In the first SubForm Wizard dialog, select the Use an Existing Form option, and select the PivotChart form to use as the subform. For this example, select the sbf1997SalesPivotChart you created in the preceding section (see Figure 18.36). Click Next. Figure 18.36. In the first SubForm Wizard dialog, select the PivotChart form you saved to serve as a subform of the new form you opened.  Accept the default name for the subform container and its label in the last Wizard dialog, and click Finish to add the subform, which has a default size of about 3.5 x 0.5 inches. Disregard the appearance of the Form Header/Footer and Detail sections in Form Design view; PivotChart forms don't display these sections in Form view. Use the sizing handles to expand the subform to within about 3/8 inch from the top, and 1/8 inch or so from the left, right, and bottom edges of the form.  Change to Form view to verify that the subform displays the PivotChart (see Figure 18.37). Change to Form view to verify that the subform displays the PivotChart (see Figure 18.37).
Figure 18.37. Perform a quick check of the initial appearance of your PivotChart subform to verify that it opens in PivotChart view. 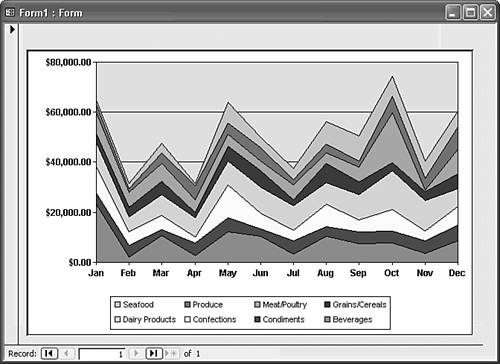 Tip If the subform opens in Form or Datasheet view, you forgot to disable all but PivotChart view in step 11 of the preceding section. Return to Form Design mode, and open the Properties window. On the Format page, set the Caption property value to 1997 Monthly Sales By Category, Allow Datasheet View to No, Allow PivotTable View to No, Allow PivotChart View to No, Scroll Bars to Neither, Record Selectors to No, and Navigation Buttons to No.  Add a label above the subform to serve as a chart title (see Figure 18.38) Add a label above the subform to serve as a chart title (see Figure 18.38)
Figure 18.38. Here's the final design of the form/subform combination to display the unlinked PivotChart. 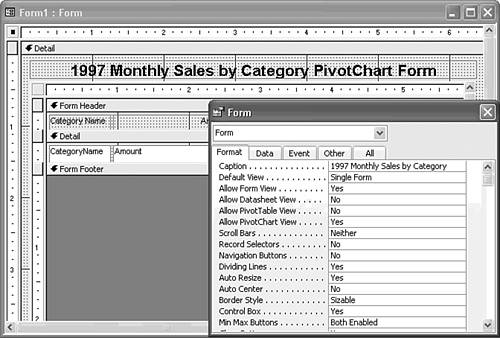 Select the subform, and set the Border Style property value to Transparent. When you return to Form view, the form/subform combination appears as shown in Figure 18.39. Figure 18.39. Adding the PivotChart form as a subform adds flexibility to form layout, and also enables conversion of the combination to a linked graph. Placing the mousepointer on a data point shows a ScreenTip with the series name and value. 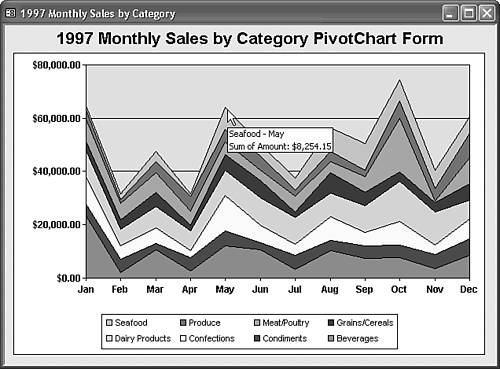 Save your form with the usual descriptive name, frm1997SalesPivotChart for this example, and close it.
Tip Use the design process described in this and the preceding section to create a report/subreport combination for printing. You can select a set of textures for the individual data series members of the PivotChart if your users need to print black-and-white reports. You can print the form to color printers, but you might not be pleased with the initial aspect ratio of the chart. By default, the chart expands vertically to fill the entire printable area of the page. To retain the aspect ratio, set the Format page's Can Grow property value to No.
Linking the PivotChart to the Main Form's Current Record Creating a linked PivotChart isn't as simple as the method described in the earlier "Creating a Linked Graph from a Jet Crosstab Query" section. The basic steps required to link a PivotChart form/subform combination are as follows: Bind the form to a table or query that you can link to the query that provides the data source for the subform and its graph or chart. Set the values of the Link Master Fields and Link Child Fields properties to the common fields of the main form and subform data sources. Add Record Navigation buttons to the main form. Modify the form and PivotChart design to take advantage of chart linking.
The following two sections describe how to modify copies of the form and PivotChart subform you created in the preceding two sections to link a graph to the Categories table. Cloning a Linked PivotChart Form/Subform Pair Take the following steps to create renamed copies of the form and subform, and link them: Make a copy of the sbf1997SalesPivotChart subform, and name it sbf1997SalesPCLinked. (Right-click the original subform in the Database window, and choose Save As to quickly create the copy.) Open the subform copy in Form view, click the Chart Type button, and select Line or Smoothline in the Chart Type Dialog's list. Click the first subtype, a standard line graph, and then close and save changes to the subform. Changing the chart to a graph verifies that you're using the correct subform when you make changes to the main form.  Make a copy of the frm1997SalesPivotChart as frm1997SalesPCLinked, and open the copy in Form Design view. Make a copy of the frm1997SalesPivotChart as frm1997SalesPCLinked, and open the copy in Form Design view.
Open the Properties dialog for the form, click the Data tab, and set the Record Source property to the Categories table. The CategoryName field of Categories table links to the CategoryName column of the subform's qry1997SalesChart data source. Set the Allow Filters, Allow Edits, Allow Deletions, and Allow Additions property values to No to create a read-only (decision-support) form. Click the Format tab and set the value of the Navigation Buttons property of the form to Yes. Right-click the label at the top of the form, and choose Change To, Text Box to replace it with a text box of the same size. Click the Data tab and set the Control Source property to ="1997 Sales for " & [CategoryName], and the Locked property value to Yes. To emulate a label with a text box, click the Format tab and set the text box's Back Style property value to Transparent. Click the edge of the subform to select the subform container, click the Data tab, and select sbf1997SalesPCLinked as the Source Object property value.  Click the Builder button of the Link Master Fields property text box to open the Subform Field Linker dialog. If CategoryName isn't selected in both the Master Fields and Child Fields lists, select that field (see Figure 18.40). Click OK. Click the Builder button of the Link Master Fields property text box to open the Subform Field Linker dialog. If CategoryName isn't selected in both the Master Fields and Child Fields lists, select that field (see Figure 18.40). Click OK.
Figure 18.40. Use the Subform Field Linker to set the Link Master Fields and Link Child Fields property values. 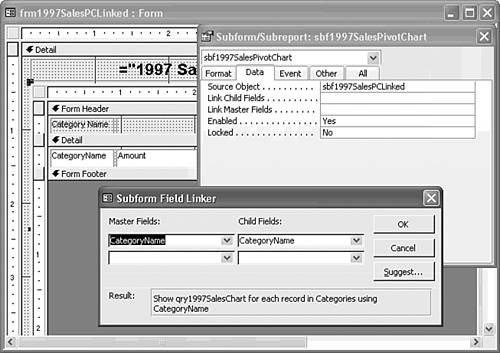 Click Form view to display the linked line graph. Navigate the Recordset to verify that the category name in the caption and the legend track one another (see Figure 18.41). Close the form/subform combination, and save your changes. Figure 18.41. The linked PivotChart subform resembles the linked MSGraph object shown earlier in Figure 18.28. 
Tweaking the Design of the PivotChart Subform After you've verified that linking is working, you can delete the legend to devote more space on the form to the graph. Like MSGraph objects, you can change the line (series member) formatting properties and add trendlines to PivotCharts. However, the process is much more tedious than that for linked MSGraph objects, because you must alter each member of the series. To delete the legend, increase the line thickness, and add a trendline to a series member, do this: Open the sbf1997SalesPCLinked form in Form view, right-click an empty area of the graph, and choose Properties to open the Properties dialog for the Chart Workspace. Be sure to open the subform, not the main form.  In the Select list, choose Legend, and click the Delete button to remove the Legend, which isn't necessary for a linked graph. In the Select list, choose Legend, and click the Delete button to remove the Legend, which isn't necessary for a linked graph.
Open the Select list and choose Beverages to select the first series member. In the General Page, click the Add Trendline button (the middle button below the Add line) to add a linear trendline to the graph. Click the Line/Marker tab, and set the Weight property to thick. Return to the General page, and select the added Beverages Trendline 1. Click the Trendline tab and clear the Display Equation and Display R-squared Value check boxes. Press Ctrl+S to save your final changes, and close the subform. Open the frm1997SalesPCLinked form in Form view to check your design changes (see Figure 18.42). Figure 18.42. Thickening the PivotChart's series line and adding a trendline duplicates the final MSGraph linked chart of the earlier Figure 18.31, except for the data points and line smoothing. 
Note  | The final versions of the forms and subforms you create in this chapter are included in the Charts18.mdb sample database, which is located in the \Seua11\Chaptr18 folder of the accompanying CD-ROM. |
Persisting Linked PivotChart Properties with VBA Code A defect in the PivotChart Web Component causes the PivotChart to lose the design changes you made in the preceding section when you move the record pointer with the Navigation buttons. This problem appeared in Access 2002 and persists in Access 2003. You must add VBA code to reapply the properties for each category's graph. The code behind the frm1997SalesPCLinked form of the Charts18.mdb sample database performs the following functions: Changes the number format of the y-axis labels from Currency to the custom $#,##0 format, which removes the unnecessary decimal digits. Sets the scale of all graphs to $25,000 so users aren't misled by scale changes when comparing results of categories with different maximum sales values for the year. Establishes a thick line weight. Adds a trendline and hides the equation and R-squared text. Changes the color of the trendline from black to red and the weight to thick.
Note The Access 2003 prerelease version used to write this book has a bug in the setup program that omits the required reference to Microsoft Office Web Components 11.0. This reference must be present to persist the linked PivotChart properties. If this reference is missing from the Visual Basic editor's References list, click Browse, navigate to the \Program Files\Common Files\Microsoft Shared\Web Components\11 folder and double-click OWC11.dll to add it to your Access project.
 Figure 18.43 shows frm1997SalesPCLinked form of Charts18.mdb with formatting applied by the Form_Current event handler. To view the VBA code, with the form open in Design view, click the toolbar's Code button to open the VBA editor. Figure 18.43 shows frm1997SalesPCLinked form of Charts18.mdb with formatting applied by the Form_Current event handler. To view the VBA code, with the form open in Design view, click the toolbar's Code button to open the VBA editor.
Figure 18.43. Code in the Form_Current event handler of Charts18.mdb's frm1997SalesPCLinked form applies the linked PivotChart formatting changes shown here.  For the details of adding VBA formatting code for PivotCharts, see "Using the On Current Event to Set Linked PivotChart Properties," p. 1223.
|