Substituting or Adding a PivotTable in a Form
|
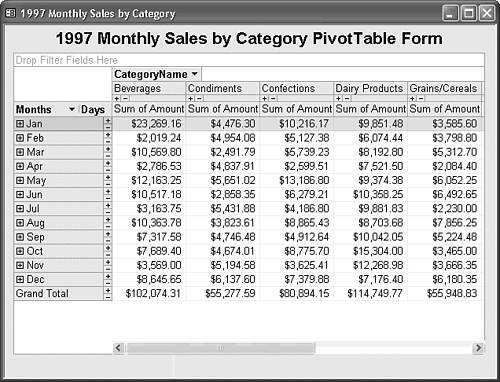
When you open frm1997SalesPivotChart, the PivotTable appears as shown in Figure 18.44. Months are row headings and product categories are column headings, so you might want to pivot the table to correspond to the graph layout. In this case, you must mark the Field Buttons/Drop Zones check box on the PivotChart Property dialog's Show/Hide page to enable pivoting when you change to PivotTable view. Figure 18.44. To substitute this PivotTable for a PivotChart, change the Allow...View and Default View property values on the Format page of the PivotChart subform. Another approach is to create individual PivotTable and PivotChart subforms. You can locate an additional PivotTable subform below the PivotChart. Alternatively, you can add a command button and VBA event-handling code to alternate between the two subforms as the Source Object property value of the subform container. Northwind.mdb's sample Sales Analysis form uses this method to alternately display Sales Analysis Subform1 and Sales Analysis Subform2.
Tip
|
EAN: 2147483647
Pages: 417