Chapter 6: Printing Data with Reports
After you have created tables, forms, and queries for a database and entered some data, you need to create reports for printing the data. Although you can create reports at any time after creating the tables, it’s a good idea to wait to create reports until you have a fair amount of representative data entered into the database’s tables, in case you need to modify table structure or relationships as you enter data. In an ideal world, you would be able to set up all the tables and fields perfectly right at the start, but in the real world it is more than likely that as you create forms and then enter data you will find that a few fields have to be changed to different data types, that some fields aren’t needed, or that a few new fields have to be created. This means you will have to make some changes to the forms—and if you have already created a number of reports, you’ll also have to change the reports to match the table changes.
Report Design Principles
Although Access lets you save a form as a report (in Access 2000—this less-than-useful feature was dropped in Access 2002) or even print a form (see the “Filtered by Form Report” section later in this chapter for more details on why this is not a good idea), neither of these choices will result in a well-formatted report. Forms use interactive controls such as comboboxes, command buttons and option groups—none of which make sense on reports. Additionally, most forms have header and footer sections that generally contain interactive controls, and any or all form sections may have colored backgrounds, which print poorly and waste toner or ink. See Figure 6.1 for an example of a form in print preview.
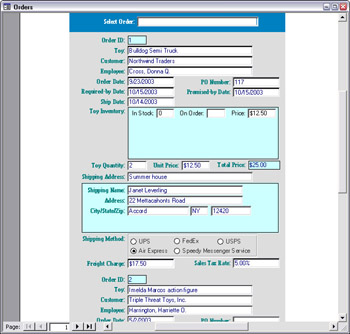
Figure 6.1
Forms (at least Single Form–type forms) generally display data one record at a time. A well-designed report, on the other hand, usually displays data from multiple records on one page, often grouped by one or more fields; some reports summarize data and only display overall and possibly group totals or counts. A report header should generally contain the report title, and possibly information such as the date the report was printed. A report footer may contain grand totals. Report page headers and footers should contain information such as the group header (in case report groups are more than one page long) and page number. And for grouped reports, the group header should contain the group header name, and the group footer might contain group subtotals.
The Report Wizard
Access has a Report Wizard, but generally you’ll have to do as much work on a report created by this wizard as you would when creating a report from scratch (or in some cases, more work). This is primarily because of problems with arranging controls on the report design grid. The Report Wizard has two AutoReport selections. If I select the AutoReport: Columnar selection in the New Report dialog with qryOrders as the record source, I’ll get the report shown in Figure 6.2.
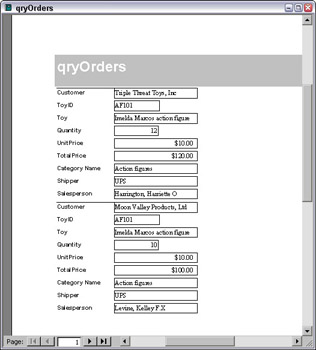
Figure 6.2
To view a report in the sample Toy Workshop (Reports Finish) database, select it by figure number from the Reports selector combobox on the main menu.
This report simply lists all the fields in qryOrders, from top to bottom, with a line between records. This is generally not a very useful format, unless you just need a basic printout of all the data for proofreading—but even for that purpose, you’ll have to do some reformatting to prevent the truncation of data in some fields. If you select tblOrders instead of qryOrders, and the AutoReport: Tabular selection, you get the report shown in Figure 6.3.
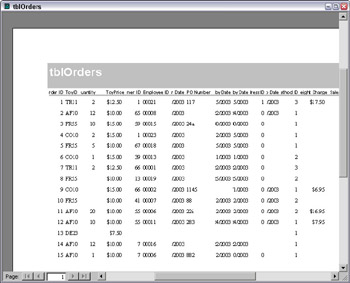
Figure 6.3
This report squashes all the selected fields into a letter landscape page, resulting in both labels and data being truncated. If you only have a few fields, this Wizard selection produces an acceptable report, but if you have lots of fields, you will have to do a lot of resizing to get an acceptable report.
For a plainer (but still ugly and virtually useless) report, there’s the AutoReport selection from the New Object selector. This creates a plain text report that arranges all the controls on the report, from top to bottom, with no header or footer, as shown in Figure 6.4.
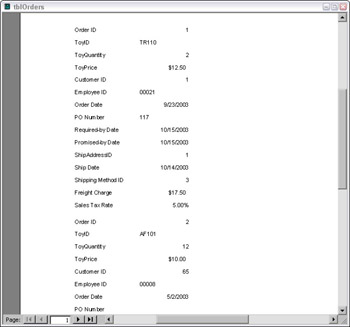
Figure 6.4
You can create a grouped report—a report where data is arranged hierarchically, sorted and grouped by several fields—with the Report Wizard. However, there is no explicit Grouped Report selection. Instead, to create a grouped report you select Report Wizard from the New Report dialog and make choices in pages of the Wizard. If you select tblOrders as the record source, select all the fields in the table, select three fields for sorting and grouping, and leave all other selections at the default, you’ll get the report shown in Figure 6.5.
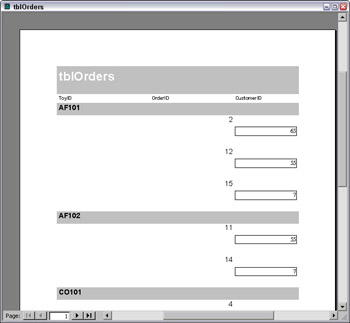
Figure 6.5
Actually, what you see is only a small portion of the report. Totally ignoring the reality of paper sizes, and despite the fact that the report is formatted for letter-sized paper with portrait orientation, the Report Wizard creates a 22-inch wide report, of which only the first three fields are visible. This report is useless (and ugly to boot).
With a wizard like this, you’re better off doing it yourself! Instead of selecting the Report Wizard from the New Report dialog, just select Design view, choose a table or query record source, and place the controls on the report grid as you wish. Or, to save time and ensure a consistent appearance for all the reports in an application, you may want to create a set of report templates, and use them as the basis for the reports you create.
Using Report Templates
Instead of using the Report Wizard, I recommend creating a set of report templates that can be customized for each application you create. You’ll need at least a portrait and landscape template in letter size (or whatever paper size you use most frequently) and possibly another set of portrait and landscape templates in a larger size. My generic report templates include grouped and tabular reports with two groups, each with both a group header and footer. For plainer reports that don’t need grouping, just delete any groups that aren’t needed. I also have a subreport template with no groups.
Each group section in a report needs its own font style and size for descriptive text and group fields, to differentiate the groups, and this means that you need to place controls with appropriately formatted dummy text in each section of the template. It is rare to need more than two or three group levels in a report (though Access allows up to ten). My generic report templates have two groups, each with a header and a footer, supplied with preformatted textboxes with sample text. I use the Arial font throughout, mostly 9 pt, with italics and bold for emphasis in group header and footer sections, and larger sizes only in the report header. The generic report template for a letter-sized portrait tabular report (rtmpTabularReportLetterPortrait) is shown in Design view in Figure 6.6.
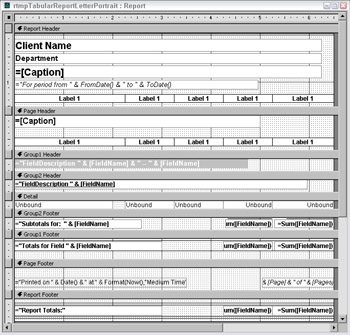
Figure 6.6
To use these report templates for an application, copy them into the application database and edit them as needed to replace the dummy text in the title and subtitle labels (“Client Name” and “Department”) with whatever standard text is appropriate for the application. In the sample database, I replaced Client Name with Toy Workshop, and deleted the Department label, moving the Caption label up.
The txtCaptionRH textbox has the control source =[Caption], which prints the report’s caption. This ensures that the report’s caption in print preview will match the caption printed on the report itself and also the report name displayed in the report selector combobox on the standard main menu (this feature is discussed in the “Creating a Main Menu with the Menu Manager Add-In” section later in this chapter).
The txtDateRange textbox displays a date range; this control source expression picks up a From Date and To Date from textboxes on my standard main menu (see the “Creating a Main Menu with the Menu Manager” section later in this chapter for more details on this menu feature). This textbox is only needed for reports you want to filter by a date range, so it can be deleted from any report that doesn’t need this feature.
The tabular report template has two sets of column heading labels, one in the report header section, and one in the page header section; the page header section is set to not print on the first page of the report. The page header section also displays the report caption, in a smaller type size than in the report header.
The Group 1 header text has a textbox with dummy text for a descriptive word or phrase, the group field, and another field (optional). It is formatted with a light gray background and white text. The Group 2 group header text is black text on a white background, underlined. The Detail section has textboxes in Arial 9, without labels (in this template, the labels are located over the columns, in the header sections). The Group 1 and Group 2 footer sections have textboxes with “Subtotals for” (or “Totals for”) text and the group field, and sums under several of the fields, which can be eliminated if they aren’t needed.
The page footer has calculated fields that display the date and time the report was printed, and the page number, in Page x of y format.
EAN: 2147483647
Pages: 124