Tabular Reports
A tabular report is laid out like a datasheet, with data displayed in rows and columns, with or without grouping. Columns are identified by labels in the page header or a group header. To create a tabular report, follow these steps:
-
Make a copy of one of the tabular report templates (probably rtmpTabularReportLetterLandscape).
-
Select an appropriate record source, such as qryOrdersFull for the sample tabular report.
-
Enter the report’s caption in its Caption property.
-
Edit the captions of the lblTitle and lblSubtitle labels in the report header as needed (unless you have already standardized them in the application’s templates).
-
If grouping on one or more fields is needed, select the group(s) in the Sorting and Grouping dialog. I selected ToyCategory and Customer, with header and footer turned on for both fields.
-
To sort on another field that doesn’t need grouping, select it on another row in the Sorting and Grouping dialog, but don’t turn on the header or footer
-
Place the fields you want on the report in the detail section, resize them as needed, and give the labels in the report header and page header sections appropriate captions.
-
Run the LNC Rename All Controls builder from the Name property of the Detail section to give all the controls the appropriate LNC tags.
-
Save the report with the rpt tag.
Figure 6.7 shows the new report in Design view, and Figure 6.8 shows it in Datasheet view.
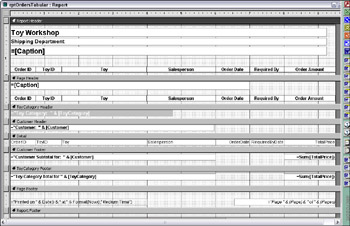
Figure 6.7
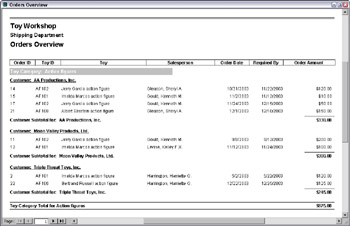
Figure 6.8
EAN: 2147483647
Pages: 124