| In Hour 2, "Getting Started with Crystal Reports 9," you were introduced to the concept of report sections. Report sections segment reports into logical areas to facilitate more intuitive report design. Report sections are identified by name on the left side of the design environment, and, by default, each report will include a Report Header and Footer, Page Header and Footer, and Details section. If you have inserted any groups into your report, you will also have a Group Header and Footer for each defined group item. As you have been creating reports in the previous hours, you have placed objects such as database fields, text fields, and corporate logo images into the various sections and organized the objects based on your report design requirements. Each section has unique properties and printing characteristics that you can modify. For example, if a report object, such as an image, is placed in the Report Header section, the image will display and print only once per report, on the first page. If the same image is placed in the Page Header section, the image will then display and print once per page. The same holds true for custom sections, such as Groups. The Detail Section, however, implies that whatever is placed in this section will display, and print, once for each and every row retrieved from the data source.  | The Crystal Reports design environment is built upon a paper metaphor with pages as a concept to facilitate the presentation of information. This page metaphor applies when referring to how reports will print and reviewing various presentation characteristics of report formatting. |
| As you might have noticed, long names (descriptive names) of each section are provided to the left of the design environment within the Design tab, whereas only the short names (abbreviated names) of sections are presented while viewing reports from the Preview tab. This maximizes the report viewing space while working in the Preview tab, yet it still allows you to access each section's properties by right-clicking on the section name (or label) and selecting from the applicable pop-up menu commands. |
We will continue using the report created in the previous hour, Hour 8, "Fundamentals of Report Formatting," to take a closer look at how to format report sections. The following exercises will demonstrate how to format sections such as the Group Header and Group Footer to improve the overall presentation of your report. In addition to modifying display properties, we will also apply conditional logic that modifies the behavior of the Page Header section based on the result of the defined condition (format formula). As you will see, the Section Expert is the central location to work with the most common report section properties, and we will use it to view and modify the properties of each report section throughout the following exercises.  | There are three distinct ways to access the Section Expert; these include Right-click on the name of the section you want to work with and select Section Expert from the pop-up menu. Click on the Select Expert toolbar button located on the Expert Tools toolbar. From the Format menu item, select the Section Expert command from the Report menu. |
-
Open the report you created in Hour 8. Alternatively, open the report entitled 09Report01.rpt (available from the Sams Publishing Web site when you search by book title www.samspublishing.com). -
Open the Section Expert. From either the Design or Preview mode, right-click on the Group Header #1 section and select Section Expert from the pop-up menu. This will present the Section Expert dialog. We will now apply a background color to our Group Header #1 report section so that the report consumers can quickly distinguish between each country and determine which customer contacts belong to each country. -
Using the Section Expert, select the Group Header #1 item from the Sections list on the left, and then click on the Color tab on the right. Click on the Background Color box so that it is activated and select Navy from the drop-down list of color options. Click OK to continue. | From within the Section Expert, you can easily navigate from modifying the properties of one report section to another without closing this dialog window. Regardless of how you open the Section Expert dialog window, you can quickly toggle to other report sections, providing a central location to access and modify the properties of all report sections. |
-
Select the Preview tab to view your report display. -
The Red font used for the object in the Group Header #1 does not look good against the Navy background color. To resolve this, highlight the text object actually a combined object consisting of a text object and a database field object and change its font color to White, as shown in Figure 9.1. Figure 9.1. Formatting the report section can make your reports more readable and friendly to the end users.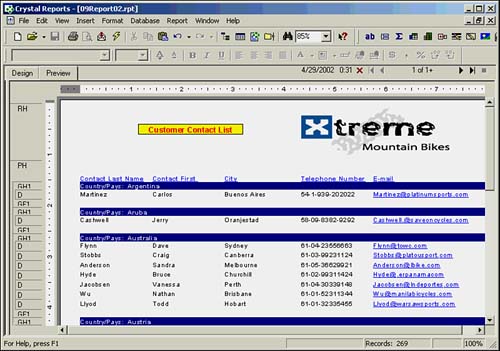
-
To complement the report structure and how you have grouped on the Country field, let's add a summary count of the contacts for each country in the Group Footer #1 section. To do this, select Summary from the Insert menu to present the Insert Summary dialog and select the following items: Customer.Contact Last Name field from the Choose the Field to Summarize drop-down list Count from the Calculate This Summary drop-down list Group #1: Customer.Country from the Summary Location drop-down list | To access the Insert Summary dialog so that you can add a summary field on to your report, you can either use the Summary command from the Insert menu or the Insert Summary button located on the Insert toolbar. |
-
After you have made these selections from the Insert Summary dialog, click OK to continue. -
You should now see the Count Summary field listed in the Group Footer #1 section of your report. To align the field values to the left and make them noticeable, use the Align Left and Font buttons located on the Formatting toolbar to apply the desired alignment and a Red font color. -
We will now add additional report section formatting to the Group Footer #1 section. From the Report menu, select the Section Expert command to present the Section Expert dialog. From the Sections list on the left, select Group Footer #1 and then select the Color tab on the right. Specify a Silver background color for this section and click OK to return to the report preview, as shown in Figure 9.2. Figure 9.2. Section formatting can be applied specifically to the various sections of your report for a more meaningful report presentation.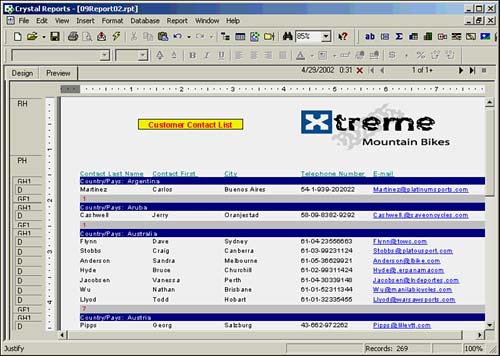
-
As a final step, we will change the font color of the database field column titles. From either the Design or Preview view, right-click on the Page Header section title and choose Select All Section Objects from the pop-up menu. After all the column title objects are highlighted, select Teal from the formatting toolbar Font Color button. As you have seen, formatting the various sections of your report is very straightforward. Each section has unique and specific properties that can be modified and used collectively to enhance the presentation quality of the entire report. | To quickly remove blank space within report sections and tighten up the alignment of the objects positioned within the sections, you can use the Fit Section command. The Fit Section command is available from the right-click menu of each report section. This will raise the bottom boundary line and reduce unnecessary space within the section. |
|