Using QFD to Synchronize Distributed Development Horizontally Across Component Teams
| In our previous example, Oil & Gas Exploration Systems (O&G) used a combination of QFD and use cases to help align cross-company decision making about their requirements for a shared earth modeling developer's kit (dev kit). In this, our final example, O&G has completed selection of a dev kit and completed necessary customizations and extensions to support the breadth of the O&G product suite. Now O&G looks to the task of planning the port of products over to the use of the new dev kit. Again, O&G will use a combination of use cases and QFD, this time to coordinate the development. This decision is motivated by problems O&G has experienced in the past working with distributed development (i.e., development that requires the coordination between a large number of component teams spread across its three business divisions: geology, geophysics, and petrophysics). This problem is further compounded by geographical separation of the teams in four cities spread across two countries.[7] One problem that can arise in such development is making sure that the vision is clear as to what needs to be worked on by each team and in what order (i.e., how to synchronize the work that is to be done). The problem is best illustrated by looking at the solution.
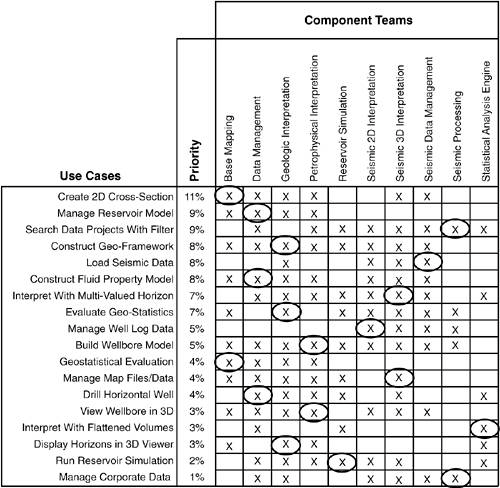
Entropy Happens in Distributed Software DevelopmentFigure 2.2 shows a matrix similar in concept to that described by Schneider and Winters: rows of the matrix are prioritized use cases, and columns component teams (the use case of Appendix A is the first row of this matrix).[8] An "X" in a cell indicates that the corresponding component team has work to do in implementing the corresponding use case. One way to construct such a matrix is to draw a sequence diagram for each use case with components as columns in the sequence diagram. All components that play in the sequence diagram receive an "X" in the matrix.
Figure 2.2. Matrix showing which component teams (columns) will participate in the implementation of each use case (rows).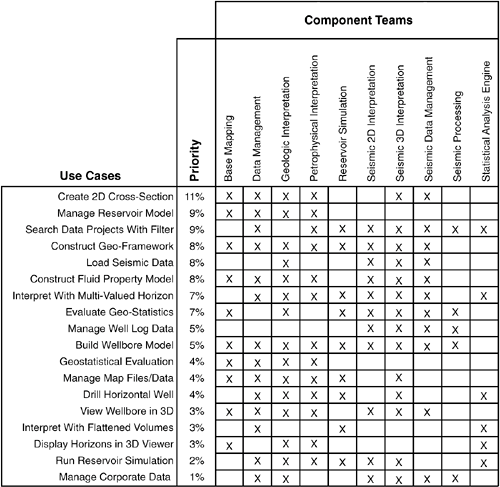 This matrix is a great way to do a summary rollup of a collection of sequence diagrams. Scanning the matrix horizontally you can quickly see all the components that play in a use case, and scanning vertically you can see all the use cases in which a component plays. A matrix like this is a valuable tool for communicating to component or product teams how their "piece" fits into the larger picture. The planning problem such a matrix is meant to obviate is illustrated in Figure 2.3, where circles indicate what each component team is working on at an instance in time. In this admittedly extreme example, though everyone is hard at work, when complete the bits won't plug together to form any meaningful functionality. Figure 2.3. Circles indicate work that each component team is doing at a given instance in time. Though everyone is hard at work, when complete the bits won't plug together to form any meaningful functionality.
While the problem with this approach is evident when looking at Figure 2.3, without use cases to provide a basis for knowing what a meaningful chunk of functionality is, and without a matrix such as this to provide a common visual roadmap for planning and coordination, distributed development can readily drift into situations similar to that illustrated in Figure 2.3, especially when teams span business groups or are separated geographically. There's a kind of a second law of thermodynamics that applies to software development: Entropy happens in distributed software development! To be fair, "software development entropy" is not the only reason you might find yourself in a situation such as that shown in Figure 2.3. In the "Big Bang Integration" style of software development (i.e., wait until all bits are done, then integrate them and test) the order in which you do component work really doesn't matter, in theory at least. For companies that utilized this philosophy but are now trying to move over to the iterative, incremental development philosophy of the Unified Software Development Process, Extreme Programming, or the Agile community in general, old habits can die hard. For whatever reason it happens, the solution to the problem shown in Figure 2.3 is obvious: make sure that the component teams coordinate and synchronize to work on the same use cases in the same priority order, with QFD providing the means to determine that priority according to a given set of business drivers.[9]
Planning the Length of Iterations and Number of Use Cases per Iteration in Distributed Software DevelopmentThere is another aspect of distributed software development that has presented problems for O&G in the past: planning the length of development iterations and the number of use cases to deliver per iteration. While this may be straightforward for use cases that are to be implemented by a single team, distributed development of use cases introduces some twists, namely:
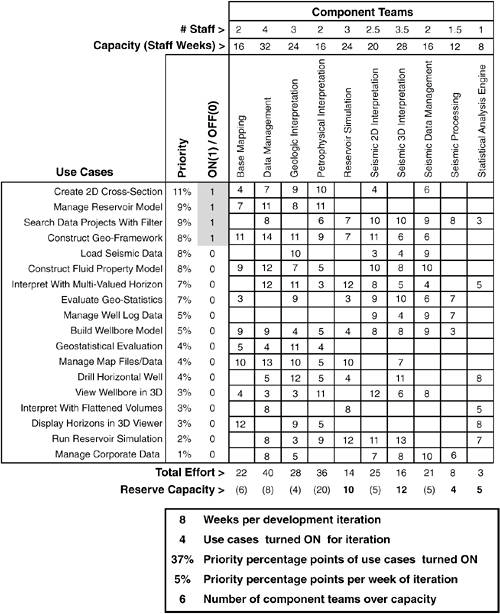
Taken together, these three factors can represent a non-trivial planning problem for use case-driven distributed development. To address these issues, O&G has developed an adaptation of the QFD matrix (see Figure 2.4; Figure 2.5 shows formulas for implementation as an Excel spreadsheet). Figure 2.5. Excel formulas for QFD matrix.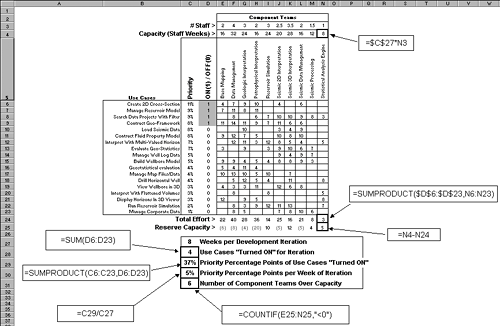 The next six sections walk you through the mechanics of the matrix in Figure 2.4 as a planning tool for use case-driven distributed development. The matrix is used to plan one iteration at a time: iteration duration (here in weeks) and scope (use cases). As the planning for one iteration is completed, the use cases for that iteration are "removed" (zeroing their priority removes them from consideration) and the matrix is reused to plan the next iteration. This process is repeated until all use cases have been allocated to an iteration. Estimating Effort Required per Component Team to Implement Use CasesThe first requirement for the O&G planning is to estimate the effort required to implement a use case on a component team basis. For this, the "Xs" of Figure 2.2 have been replaced in the matrix of Figure 2.4 with estimates of effort, here expressed in terms of staff weeks (e.g., 2 staff working 4 weeks = 8 staff weeks of effort).[12] Taking the sum of all effort in a column provides the total effort required of a component team if all use cases are implemented.[13]
But O&G wants to be able to play what-if games with the length and scope of a development iteration, including and excluding use cases to see what the total impact is on each component team in terms of required effort for different sets of use cases. To do this, a new column is added to the matrix: ON(1) / OFF(0). This column lets the O&G planning team turn use cases "ON" or "OFF" for an iteration (i.e., be part of the next iteration or not). Row Total Effort at the bottom of the matrix then tallies the effort, per component team, for just the use cases that have been turned "ON". Estimating Capacity of Each Component Team for WorkAs the O&G planning team does what-if analysis adding use cases to an iteration, they need some way to tell whether each of the component teams has been pushed over its limit in terms of how much work it can take on. To address this, O&G planners first need to estimate the work of which each team is capable. For this, two new rows are added to the top of the matrix; refer to Figure 2.5. The first, # of Staff, is used to specify the number of staff that is available for work on each component. Part time availability of staff is represented as a fraction (e.g., component teams 2D and 3D Seismic Interpretation have one member that splits their time equally between the two teams; hence, 2.5 and 3.5 available staff, respectively). The second new row at the top of the matrix is Capacity, which is measured in staff weeks of effort. The cells of this row are calculated by taking the number of staff that are available to work on each componentprevious row, # Stafftimes the number of weeks planned for the iteration (see Weeks per Development Iteration at the bottom of the matrix in Figure 2.4). For example, the capacity for the Data Management component team is 4 staff times 8 weeks of development, which equals 32 staff weeks of work. Determining Component Teams that Are Over AllocatedWith these new rows, the O&G planning team is now able to determine when component teams have exceeded their limit in terms of how much work they can take on. A row at the bottom of the matrix (refer to Figure 2.4)Reserve Capacitycalculates the difference between available capacity of component teams (row Capacity) and what is required of them by the set of use cases that have been turned "ON" (Total Effort). Negative values for Reserve Capacity (shown in parenthesis) indicate a team that is being asked to do more work than they have capacity for. For example, notice that in the matrix with the top four ranking use cases selected, the capacity of six component teams to deliver has already been exceeded. Keeping Score of What-If ScenariosJust below the matrix in Figure 2.4, a number of measures are grouped into a box to allow the O&G planning team to "keep score" of the what-if analysis, comparing the results of one what-if scenario to the results of the next. The scoreboard includes simple measures, such as:
Maximizing the Bang for the BuckAll that remains is for the O&G planning team to find a set of use cases that maximizes the bang for the buck for the iteration, while staying within the capacity of each of the component teams. This is certainly something that can be done by trial and error manually. As luck would have it, however, the problem of planning the number of use cases per iteration that a distributed development team can implement fits pretty well into the mold of what is called an optimization problem for which relatively inexpensive tool support is available, for example, as add-ins to Excel. This is fortunate for O&G, whose large cross-company programs sometimes have QFD matrices two and three times the size of Figure 2.4. An optimization problem is one that can be cast in a form like the following:
Using a matrix like that of Figure 2.5, you can couch the planning of use cases for an iteration as an optimization problem like this:[14]
Figure 2.6 shows an optimized matrix produced using Evolver, an optimization problem solver add-in for Excel.[16] Figure 2.7 illustrates the Evolver setup used to produce the matrix of Figure 2.6. In this case, Evolver was set to consider development iterations lasting between 4 to 8 weeks, a constraint imposed by the business needs of O&G.[17]
Figure 2.6. Planning the number of use cases per iteration in distributed software development cast as an optimization problem.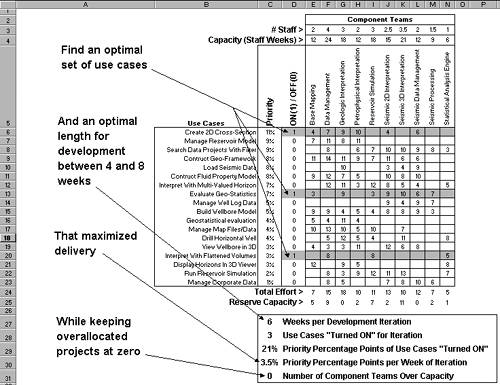 Figure 2.7. Evolver is an optimization problem solver add-in for Excel. The setup shown here was used to produce the optimized QFD matrix of Figure 2.6.
First Iteration Planned: Plan Subsequent IterationsTo summarize the results of Figure 2.6, the answer to the optimization problem produced by Evolver is for an initial development iteration of 6 weeks with delivery of three use cases (in gray) which average to 3.5% priority percentage points per week of development (sum of priority percentage points of use cases to be delivered divided by six weeks). In doing this, several teams are down to a reserve capacity of zero, and several more close to capacity (i.e., they have all the work they can handle). With that, the planning for the first iteration of development in O&G's port of its products to the new shared earth model is complete. To plan the second iteration, O&G repeats the process with the use cases identified from the first iteration removed from the matrix (setting their priority to zero will do the trick). This process is repeated until all use cases have been allocated to an iteration. The result will be a schedule that delivers the highest-priority use cases per iteration and utilizes component teams as well as can be expected while not over-allocating any. |
EAN: 2147483647
Pages: 109
