Using QFD to Align Decision Making Horizontally Across a Company
| We begin this chapter by looking at an example of QFD applied to cross-company decision making. This example is based on an actual program[1] in which I helped get the team going in its use of QFD, but the real work was done by a sharp team of geoscientists and developers and coordinated largely by a colleague.[2] This example has been simplified and tweaked a bit to better convey the QFD process; results of analysis and decisions reached are kept somewhat vague to protect proprietary information.
A Brief Overview of Oil and Gas ExplorationSearching for oil, an activity that started in the 1850s as a hit or miss, by the seat-of-the-pants outing, has today grown into a big industry that employs big science. Big geoscience and computer science, to be specific. At the risk of oversimplifying, the search for oil and gas today can be said to involve building elaborate computer models of the surface and sub-surface of the area where you think oil exists, then drilling exploratory wells where the models indicate the greatest probability for oil that can be recovered in a profitable fashion. A number of different disciplines have evolved through the years for searching for oil, each with its own use cases ("workflows" in geoscience lingo) and approach to modeling the earth. Three key disciplines used in oil and gas exploration are geology, geophysics, and petrophysics. Each provides a piece of a large puzzle that must be assembled in order to determine what may lie beneath the surface of the earth. Let's look briefly at these three disciplines. Geology, the oldest of the geoscience disciplines, utilizes models built on what we know about the earth's strata, or distinctive layers of rock, such as the Permian, Triassic, Jurassic, Cretaceous, and Tertiary. The goal with these models is to find a convergence of the geologic elements we know from empirical observation are needed to form and trap oil and gas. Geophysics, on the other hand, is a more recent discipline, being applied to oil exploration for the first time in the early 1920s. Geophysics utilizes models based on seismic data of the earth obtained by "thumping" the earth and listening for the return of sound energy reflected off the earth's subsurface structuresrocks, salt domesto produce an image of the earth's subsurface. Petrophysics builds models of the earth based on direct measurement of the subsurface made from the boreholes of wells drilled into the earth, a process called well-logging. Well-logging got its start in 1912 when a Frenchman, Conrad Schlumberger, hit upon the idea of lowering tools into a borehole to make electrical measurements of the subsurface rocks. Today, a variety of measurements such as electrical resistivity, nuclear properties and sonic travel times provide empirical evidence of the makeup of the earth's subsurface where a well has been drilled. In our next example, we look at a hypothetical companyOil & Gas Exploration Systems (O&G for short)that builds software systems that oil companies buy or lease for earth modeling as part of their exploration for oil and gas. In the example, O&G turns to QFD to plan the next big evolution in their product line: a multi-disciplinary approach to oil and gas exploration. The Problem: Selecting A Shared Earth Modeling Development KitO&G has different products, made of a variety of components, for each of the disciplinesgeology, geophysics, and petrophysics. For a variety of reasons, the product lines developed independently as part of separate business divisions. As the need to improve the efficiency of oil and gas exploration grows, O&G (and the industry in general) has come to recognize the importance of integrating these products and their respective disciplines so that information is quickly and easily shared between them in near real-time, a concept that in the industry is called shared earth modeling. In order to accomplish this level of integration in its product suite, O&G has decided to invest in the development of a developer's toolkitor dev kitfor earth modeling that can be shared company-wide across all components of its product suite. Rather than starting from scratch, O&G will use the source from an existing dev kit as a starting place and then customize and extend it as needed to support the breadth of the O&G product suite. O&G has decided to use QFD to analyze their needs for such a dev kit, then select from among a variety of candidate dev kits available internally (e.g., as part of existing products and research efforts) and externally from various consortia. O&G's QFD Road MapFigure 2.1 shows the QFD road map that O&G plans to use to analyze their needs for a dev kit; let's walk through the process quickly. The QFD process uses four QFD matrices:
Figure 2.1. O&G's QFD road map for selecting a shared earth modeling dev kit.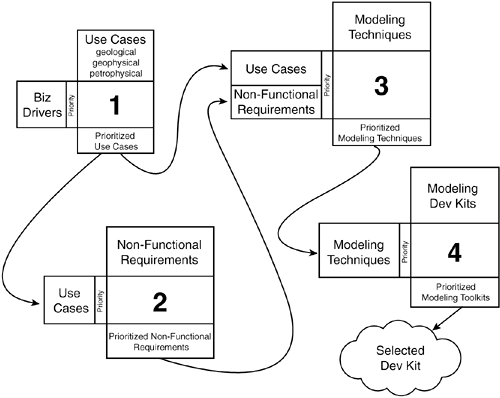 Working from Figure 2.1, let's walk through the QFD process in more detail. O&G will use a workshop much like the one described in the previous Mega Motors example, but details of the workshop itself will not be elaborated upon. Also, actual results of each of the four matrices of Figure 2.1 are not provided but are described in terms of their general inputs, analysis done on them by the O&G team, and their outputs. This is done in part to protect proprietary results of the actual program this example is based upon. This also helps you focus on the main point of the example, the mechanics of QFD as a decision-making tool, by avoiding overly detailed examples from geoscience and earth modeling (a domain many readers may not be familiar with). No two applications of QFD are likely to be quite the same, so differences in the Mega Motors and O&G example will be highlighted to illustrate just some of the variations that can occur. Matrix 1: Prioritize Use CasesThe O&G QFD team has been selected to include geoscientists and developers from each of the disciplines that the dev kit must support: geology, geophysics, and petrophysics. The QFD process begins with Matrix 1. Identify Use CasesWhereas the Mega Motors QFD process began with the team thinking about business drivers, the O&G team begins by thinking about the essential use cases that must be supported by an earth modeling dev kit. Use cases come naturally to geoscientists because the process of oil and gas exploration has traditionally been described in terms of what they call workflows, which are essentially the steps in a use case. The use case of Appendix A, "Sample Use Case," named Create 2D Cross-Section, is an example of the type of use case the O&G team identifies, and it illustrates the combined use of three disciplinesgeology, geophysics, and petrophysicsfor oil and gas exploration. (Understanding this use case is not essential to this QFD example and is provided solely for informational purposes.) After the O&G QFD team has identified all the essential use cases for all the products, they are entered as columns of Matrix 1 (refer to Figure 2.1). Identify Business Drivers to Prioritize Use CasesNext, the team turns its attention to what criteria form a basis for prioritizing their use cases. As already noted, this is different from the Mega Motors example where the team started with the business drivers. While this may be out of the norm from a "standard" manufacturing QFD perspective, it reflects the real-life diversity you are likely to experience in using QFD. Used in this fashionuse cases first, business drivers secondthe question that the team asks themselves is: What is it that makes one use case more important than another in terms of this project (i.e., selection of a shared earth modeling dev kit)? In doing this, the team works backwards to an agreement on what the business drivers for the project are. Either wayworking forward as in the Mega Motors example, or backwards as the O&G team is doingthe end result is the same: team alignment. The O&G team uses pros and cons analysis of the use cases to help understand as a group what criteria makes one use case more important than another and arrives at the business drivers shown in Table 2.1. These are entered as rows in Matrix 1 (refer to Figure 2.1).
Analyze Relationship of Business Drivers to Use CasesGiven a prioritized set of business drivers and essential use cases for each of the three O&G disciplines, the QFD team scores each use case in terms of the business drivers, resulting in a set of prioritized use cases (refer to bottom of Matrix 1 in Figure 2.1). There is a subtle difference between this process for the O&G team and that used by the Mega Motors team. Recall that the Mega Motors team was asked to identify the use cases that best met a given business driver by restricting the number of high scores (i.e., a 9) they allocated on a row. While the Mega Motors team was trying to find the best use case for a video storyboard, the O&G team is trying to factually record the relationship between business drivers and use cases. So for a given business driver, such as Benefit Derived (refer to Table 2.1), it could in principle be that every use case does indeed deserve a high score for this business driver (i.e., a 9). Here's a heuristic you can use to try to tell if you should restrict the number of high scores on a row when working row-wise: Are you trying to find the best choice(s) on the row, or are you trying to weed out the ones that don't apply? If you are trying to find the best choicesay, the best use casefrom among a number of candidates, restrict use of high scores to force the team to make the difficult decision of identifying the best of the best. If, however, you are trying to simply weed out the ones that don't apply, in principle all could very well receive high scores. How do you know which you are trying to do: find the best or weed out the non-applicable? That just depends on the problem at hand, and answering that question is part of the team alignment that takes place as part of the QFD process. With the completion of Matrix 1, the O&G QFD team moves on to Matrix 2 (refer to Figure 2.1). Matrix 2: Prioritize Non-Functional RequirementsNext, the team turns its attention to the quality requirements or, as we'll call them here, the non-functional requirements, of the dev kit. They begin with a new matrixMatrix 2and populate the rows with the prioritized use cases from Matrix 1. Identify Non-Functional RequirementsThe Mega Motors team had a standard set of non-functional requirements they used for the automotive industry (e.g., reliability, safety, and so on). The O&G team decides to take a little more analytical approach and reviews each use case by asking, What non-functional requirements are pertinent to this use case? And, in fact, non-functional requirements are fairly standard attire for what Alistair Cockburn calls the fully dressed use case (Cockburn 2000), so the team is accustomed to this as part of their normal use case-driven development. The difference now, however, is that the non-functional requirements will be prioritized with respect to the suite of use cases as a whole. This is an example of the value added by QFD to use case development. Following is a sample of some of the non-functional requirements identified by the O&G team as being pertinent to their use cases:
Notice that the O&G team is careful to specify for each non-functional requirement the desired "direction" (e.g., for something like speed, faster is better). This is, in fact, standard practice in QFD and is just one more step in making sure that a team is aligned in their thinking. To complete this step, the non-functional requirements identified by the team are placed in the columns of Matrix 2 (refer to Figure 2.1). Analyze the Relationship of Use Cases to Non-Functional RequirementsAs just noted, while non-functional requirements are a part of the fully dressed use case, QFD adds an additional bit to this relationship by helping identify non-functional requirements that are highest priority to a suite of use cases as a whole. Given a prioritized set of use cases (rows) and non-functional requirements (columns), the QFD team scores each non-functional requirement in terms of its importance to each use case. The result: a prioritized set of non-functional requirements (refer to the bottom of Matrix 2 in Figure 2.1). With Matrix 2 complete, the O&G QFD team moves to Matrix 3 (refer to Figure 2.1). Matrix 3: Prioritize Earth Modeling TechniquesThe team has arrived at what is, in some sense, the heart of the decision about which shared earth modeling dev kit they will use: the prioritization of modeling techniques in terms of use cases and non-functional requirements. In techniques for modeling, simulating, and analyzing the earth is where Big Geoscience meets up with Big Computer Science, combining mathematics, physics, the geosciences, computer aided design (CAD), computer simulation, and decision analysis. Again, the team begins with a new matrixMatrix 3and populates the rows with both the prioritized use cases of Matrix 1 and prioritized non-functional requirements of Matrix 2. Identify Modeling TechniquesFrom their knowledge of the modeling techniques used in O&G's own product suite, plus those known to be supported in competitor's products and those supported in open source dev kits, the team puts together a set of modeling techniques they believe should be considered as a basis for shared earth modeling. Here are a few examples the team feels are important to consider:[4]
Now that the team has identified the list of modeling techniques for consideration, they are entered into the columns of Matrix 3 (refer to Figure 2.1). Analyze Relationship of Use Cases and Non-Functional Requirements to Modeling TechniquesGiven a prioritized set of use cases and non-functional requirements, the QFD team scores each modeling technique in terms of how well it supports each use case and how well it meets each non-functional requirement. The result is a prioritized set of modeling techniques (refer to the bottom of Matrix 3 in Figure 2.1). Matrix 4: Prioritize Shared Earth Modeling Dev KitsThe O&G QFD process concludes with a final matrix, Matrix 4 (refer to Figure 2.1). The team populates the rows of Matrix 4 with the prioritized modeling techniques from Matrix 3. The list of candidate dev kits being considered by O&G are then put in the columns of Matrix 4. These candidates include dev kits available internally as part of existing products and research efforts and externally, such as gOcad (Geo Computer Aided Design), a dev kit developed and maintained by a consortium of companies and universities sponsoring research in 3D earth modeling.[6]
The QFD team then scores each dev kit in terms of how well it supports each modeling technique. The final result of the O&G QFD process is a prioritized set of dev kits (refer to the bottom of Matrix 4 in Figure 2.1). Example Conclusion and SummaryWith the completion of Matrix 4 in Figure 2.1, the O&G QFD process is complete. The process has produced not only a prioritized set of dev kits but also a list of questions that need to be answered and assumptions that must be validated. When addressed, however, the team will be ready to make a recommendation on the winning dev kit as the future basis for shared earth modeling for the O&G product suite. As in the case of Mega Motors, after the O&G QFD team makes its final recommendation it will be possible to explain the train of thought leading to the recommendation, and additional what-if analysis can be performed by examining alternate priorities on use cases, non-functional requirements, modeling techniques, and so on. The O&G example is not only an example of how QFD can be used to align decision making horizontally across a company, it also reiterates the theme from the previous chapter of QFD as a means of driving vision vertically through a project or, in this case, a cross-company program. Starting with use cases and business drivers used to prioritize them, the O&G team has used QFD to translate them into decisions about which modeling techniques work best for the company and eventually into the selection of a dev kit for shared earth modeling. In Chapter 1, the point was made that although QFD is a tool that can certainly be used by an individual, its real value is as an approach for team product planning, prioritization, and decision making. It is a way to get a team "on the same page" and with the same vision of where a product needs to go. The O&G example you've just seen demonstrates this idea when the "team" is a company. In fact, the bigger the team, the greater the leverage afforded by QFD. In the actual case study which the O&G example represents, participants noted as part of a review of the overall process that a primary value of having used QFD was that the elements of the decision making process were made very explicit and communication enhanced among the cross-company players. In the politically charged atmosphere of a company, those two things alone may be enough to justify QFD! |
EAN: 2147483647
Pages: 109