11.14 Using event logs
|
| < Day Day Up > |
|
All Windows applications, including Exchange, record errors and events into the application event log on the server. The Windows Event Viewer is therefore the first place to look when you have an Exchange problem. You also should regularly check the event logs for informational and warning entries that might provide advanced warning of an impending problem. Some thirdparty monitoring products allow you to collect information from the event logs on multiple servers, correlate the information, analyze the collected data, and trigger alerts or actions on the basis of the analysis of the collected data.
11.14.1 Configuring diagnostic logging
By default, Exchange automatically logs only critical Exchange events and errors. However, you can easily change the type of events that are logged for the Exchange services to gather additional information needed to diagnose problems. You must configure diagnostic logging separately for each server.
You can use the following procedure to set the logging level for Exchange services.
-
Start ESM from the Windows Start menu by selecting All Programs →Microsoft Exchange →System Manager.
-
Expand the Administrative Groups section.
-
Expand the administrative group (e.g., First Administrative Group) that contains the server you want to monitor.
-
Expand the Servers section.
-
Right-click on the server and select Properties (Figure 11.25).
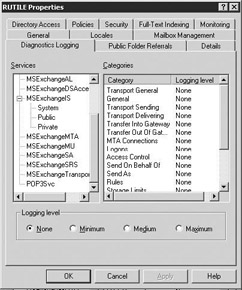
Figure 11.25: Server Properties – Diagnostics Logging tab -
Diagnostics Logging tab Select the Diagnostics Logging tab.
-
In the Services list, select one of the services for which you want to log events. The exact list of services displayed in the Services list will vary depending on the Exchange components that you have installed on the server. When you select a service from the Services list, Exchange will display a list of categories associated with the selected service.
-
In the Categories list, select a category for which you want to log events and then select one of the following Logging levels:
-
None. This logging level records only critical events and errors. Under normal circumstances, the log level should be set to None for all Exchange services. When investigating a problem, you can increase the diagnostic logging level for the service being investigated.
-
Minimum. In addition to critical events and errors, this logging level records a single entry for each major task the service performs. You can use this logging level to help determine the source of those problems.
-
Medium. In addition to the events recorded at the minimum logging level, this level records an entry for each step taken to run a task. Once you have identified the major task that is the source of a problem, you should use the medium logging level to gather additional information.
-
Maximum. In addition to the events recorded at the medium logging level, this level records an entry for each line of code in the service. This logging level provides a detailed list of events but creates a large amount of data and can affect server performance.
-
-
Select OK when done. Events will be recorded in the Event Viewer’s application log.
-
Once you have resolved the problem, remember to set the logging level back to None to avoid collecting data that is no longer necessary.
11.14.2 Viewing event logs
You can view the Exchange log entries by using the Windows Event Viewer. Event Viewer maintains several separate logs, including an Application Log, Security Log, System Log, Directory Service Log, and File Replication Service Log. Exchange informational, warning, and error events are recorded in the Application Log. For each log file, you can configure the maximum size, how long to save entries, and whether to automatically overwrite existing events when the log file becomes full. Overwriting log files is not recommended. Instead, you should periodically archive the logs and then clear the old entries to avoid running out of disk space.
You can use the following procedure to view Exchange events recorded in the Application Log.
-
Start the Event Viewer from the Windows Start menu by selecting All Programs →Administrative Tools →Event Viewer.
-
Select Application in the Event Viewer’s left pane. The Event Viewer will display application log events in the details pane. This includes events recorded by Exchange services and events recorded by other applications. You can sort the events by selecting the column heading. An up or down arrow will appear in the sort column heading to indicate whether the events are sorted in ascending or descending order.
-
You can filter the log file to show entries for a specific service by selecting Filter from the View menu. Use the Event Source drop-down list to select one of the Exchange services.
-
You can view the details for an event by double-clicking on the log entry.
|
| < Day Day Up > |
|
EAN: 2147483647
Pages: 128