Viewing and Printing Summary Reports
|
|
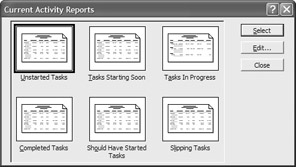
Printing views and reports provide the hard documentation that you sometimes need to evaluate in the status of a project and communicate information to project stakeholders. At this point in the project, you may be interested in printing some of the project in-progress reports, such as Tasks in Progress, Should Have Started Tasks, and Slipping Tasks. These reports are available from the Reports menu (ViewØReports and choose Current Activities).
Costs reports—such as the Cash Flow, Overbudget Tasks, and Overbudget Resources reports—provide invaluable cost information to help you make necessary budget adjustments. The Overallocated Resources reports on the Assignment button and the Task Usage and Resource Usage reports on the Workload button all provide an in-depth look at the status of resource assignments. And, of course, any of the Overview reports give you a snapshot of the project as it stands on a global basis.
You can learn more about printing views and reports in Chapters 16 and 17.
To help you see the status of the project schedule, you may want to add progress lines to the Gantt chart or Tracking Gantt, as shown here. When you add progress lines, Microsoft Project draws a line that connects in-progress tasks and tasks that should have started. Peaks pointing to the left represent work that is behind schedule, and peaks pointing to the right represent work that is ahead of schedule.
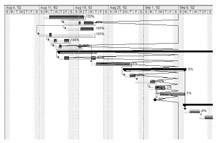
To add progress lines to any Gantt chart, click the Add Progress Lines button on the Tracking toolbar. (Remember to display this toolbar by selecting View Ø Toolbar Ø Tracking.) When the pointer changes to a tracking line shape, click in the Gantt chart at the desired date to insert a progress line.
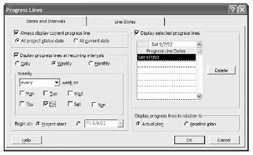
To define progress lines, choose Tools Ø Tracking Ø Progress Lines to open the Progress Lines dialog box, and follow these steps:
-
Select the Always Display Current Progress Line check box to always display the current progress line.
-
Click At Project Status Date or At Current Date to indicate where you want the progress lines to appear.
-
Select the Display Progress Lines at Recurring Intervals check box; then click Daily, Weekly, or Monthly to specify a time interval to display progress lines at specific time intervals.
-
Indicate whether you want the progress lines to start at the Project Start date or another date that you define.
-
Select the Display Selected Progress Lines check box and then type or select the dates for which you want progress lines displayed to display a progress line on a specific date. Click the Delete button if you want to remove a date.
-
Choose whether you want to display progress lines in relation to the actual plan or the baseline.
-
Click the Line Styles tab and then select progress line type, color, progress point shape, and progress point color for the current and all other progress lines. You can also indicate if you want a date displayed for each progress line.
-
Click OK to close the Progress Lines dialog box and then apply the progress lines.
Using Earned Value Analysis to Analyze Project Performance
Real projects don’t run precisely on schedule or on budget. When you have tasks starting and finishing ahead of schedule, or tasks that are slipping behind, and costs running over or under budget, it’s hard to tell at a glance whether you’re under budget because you’re behind schedule or under budget because you’re spending less than what’s budgeted. (You’re just grateful that you’re not behind schedule and over budget!) It’s good to know that you’re going to run out of money before you actually do run out. Earned value analysis is a set of simple calculations that separates budget performance from work performance so you can manage costs and work in the midst of the chaos.
Earned value analysis uses three task-related values to calculate variances and ratios that drive project performance analysis and management. There’s a bit of arithmetic involved in these values, variances, and ratios, but it’s worth examining the formulas so you understand how to apply the values to analyze your project. The task-related values are as follows:
Budgeted Cost of Work Scheduled (BCWS) The cost that would have been incurred for a task from the beginning of the project until the status date if the task were incurring the scheduled costs. BCWS is the baseline budget.
Budgeted Cost of Work Performed (BCWP) The cost that should have been incurred between the beginning of the project and the status date, based on the actual work performed. BCWP is the actual hours calculated at the baseline cost, and is also called earned value.
Actual Cost of Work Performed (ACWP) The actual cost incurred for the task between the beginning of the project and the status date. ACWP is actual costs for the task.
BCWS and BCWP are both calculated from the project baseline, so you must save a baseline before you can do earned value analysis. There’s another way to describe these three fundamental values. It’s overly simplistic, but clearly underlines the differences between the three:
-
Budgeted Cost of Work Scheduled is the baseline hourly cost multiplied by the baseline scheduled hours (BCWS = baseline cost * baseline hours).
-
Budgeted Cost of Work Performed is the baseline hourly cost multiplied by the actual hours (BCWP = baseline cost * actual hours).
-
Actual Cost of Work Performed is the actual hourly cost multiplied by the actual hours (ACWP = actual cost * actual hours).
To see how the three values are calculated, let’s look at a task that has 80 hours of work over 10 days’ duration in the project baseline. The resource assigned to the task in the baseline costs $12.50 an hour, so each day of work was budgeted to cost $100. The project manager had to assign a different resource that costs $16 per hour. At the end of the third day, only 20 hours of work have been performed rather than the 24 hours that were scheduled. Figure 12.9 shows the task’s BCWS, BCWP, and ACWP at the end of the third day. (Figure 12.9 also shows two additional columns, SV and CV, which are discussed in the next section.)
-
BCWS: 24 hours were scheduled at $12.50 per hour, so the cost of these three days in the baseline budget is $300 (24 * $12.50).
-
BCWP: 20 hours of work were performed, so the budgeted cost of the actual work is $250 (20 * $12.50).
-
ACWP: 20 hours of actual work were performed at an actual rate of $16, so the actual cost of work performed is $320 (20 * $16).
Tip If you’ve ever taken a course in managerial accounting, you’ll remember these concepts of earned value analysis from labor and material variance calculations.

Figure 12.9: Earned value fundamentals
Calculating Earned Value Variances
The three task-related values are used to calculate two variances and two ratios, which is where it really gets interesting. Schedule variance (SV) compares BCWS to BCWP (budgeted costs for scheduled and actual work) and isolates the budget difference attributable solely to the difference between scheduled work and actual work. Cost variance (CV) compares BCWP and ACWP (budgeted and actual costs for actual work) to isolate the budget difference solely attributable to the difference in resource costs.
SV = BCWP – BCWS
CV = BCWP – ACWP
The variances are in dollars. Looking back to Figure 12.9, you can see that schedule variance (SV) is a negative $50: ñ $50. Cost variance (CV) is – $70.
Calculating Earned Value Ratios
The variance figures reflect the budget for the task, so it’s hard to compare the results from one task to another task with a very different workload or hourly cost. A variance of $50 halfway though a one-day task may be worth noticing. A variance of $50 near the end of a yearlong task is chickenfeed or peanuts or some other cheap livestock food.
It’s more useful, then, to look at these variances in relation to the total work or cost of a project. The two most useful indices of this type let you compare one task to another or one project to another project at the same point in a schedule:
Schedule Performance Index (SPI) is the ratio of actual work performed to the scheduled work (SPI = BCWP / BCWS).
Cost Performance Index (CPI) is the ratio of baseline budget costs to the actual costs incurred for the task (CPI = BCWP / ACWP ). (CPI, by the way, is not to be confused with the Consumer Price Index, which is clearly not well managed.)
Calculating Cost Estimates
Project also uses the actual costs and work to estimate the financial future of your project. These estimates aren’t strictly part of earned value analysis, but they answer the questions that loom just over the project horizon:
Estimate at Completion (EAC) includes fixed costs, actual costs, plus the remaining costs for a task. Note that this estimate is the estimate if the remainder of a task’s work is completed as budgeted.
Baseline Cost, or Budget at Completion (BAC) is as described: fixed costs plus baseline resource costs. BAC includes overtime hours at the overtime rate and standard hours at the standard rate.
Variance at Completion (VAC) is the difference between BAC and EAC (VAC = BAC ñ EAC.)
Now the good news: You’re working on a computer with a first-class software package, so you don’t have to calculate any of these fundamental values, variances, ratios, or estimates. To see all the earned value variances and cost estimates, display the Earned Value table in any task view. To display earned value columns in a Gantt chart:
-
Switch to Gantt Chart view (ViewØGantt Chart).
-
Choose ViewØTablesØMore Tables to open the More Tables dialog box.
-
Select the Earned Value table and then click Apply.
The Gantt chart with earned value columns for the XYZ-BOT project file is shown in Figure 12.10.
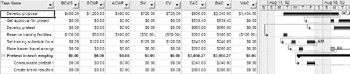
Figure 12.10: Project calculates all the earned values variances.
| Tip | You can add the fundamentals, variances, ratios, and cost estimates to any task view by inserting a column. |
Analyzing Variances and Ratios
The three fundamental values (BCWP, BCWS, and ACWP) aren’t used directly in analysis. The two variances—schedule variance and cost variance, which can be either positive or negative numbers—are the more important values. The larger the number, the greater the variance between performance and the schedule, or the actual cost and the baseline. When SV or CV are positive, things are looking good. Positive schedule variance means that tasks are ahead of schedule. When cost variance is positive, the project is under budget.
Negative variances are bad news. When schedule variance is negative, the project is behind schedule. If the cost variance is positive, you have some room to add resources to solve the schedule problems. If cost variance is negative, the project is currently over budget.
The earned value indices are small numbers. If there is no schedule variance, SPI is 1.0. If there’s no cost variance, CPI is 1.0. As with the variances, negative numbers (in the case of an index, a number less than 1.0) mean that the project is behind schedule or over budget. Numbers greater than 1 are good. If CPI is greater than 1, the project is ahead of budget. If SPI is greater than 1, the project is ahead of schedule.
| Tip | If you want to track your progress when bringing a project back on schedule or within budget, add the CPI and SPI columns to the Gantt chart, and keep track of changes to the indices at the project or phase level on a weekly or monthly basis. |
Analyzing the Cost Estimates
The Estimate at Completion and Baseline at Completion estimates are less important than the Variance at Completion (see Figure 12.12). VAC indicates whether the project will finish over or under budget. If VAC is positive, the project will finish under budget. Negative VAC means that the project will finish over budget. If the budget is constrained, a negative VAC is a call to action if the project is to be completed at all.
Bear in mind that the Variance at Completion estimate is not the result of a trend analysis. If your project is running over budget at the halfway point, VAC reflects the estimate if all remaining tasks are completed within the baseline budget. If you feel the over budget performance will continue for the duration of the project, multiply the VAC by the inverse of the percent of the project completed for an estimate of the true variance at completion. In this example, we’d multiply the VAC by 2 because the project is 50% completed (1 divided by 50% is the inverse of 50%). If the project is 75% completed, and you expect the current budget trends to continue, multiply VAC by the inverse of 75%, 1.33 (1 divided by 0.75 = 1.33).
Applying Earned Value Analysis to Resources and Assignments
Earned value analysis isn’t limited to tasks. You can use earned value analysis to analyze resources and assignments to see who or what is over budget and behind schedule. If you’re looking for a scapegoat, earned value analysis will help you find at least one. You, of course, would be the other scapegoat because you assigned the resources to the tasks in the first place. But we digress.
| Tip | Use earned value analysis in a resource view filtered for materials resources to see variance in materials usage for project tasks. |
To see the earned value analysis fields for resources or assignments, switch to an appropriate view, display the Earned Value table by choosing ViewØTableØMore Tables, and select Earned Value from the More Tables dialog box. A Resource Usage sheet with the earned value columns is shown in Figure 12.11.
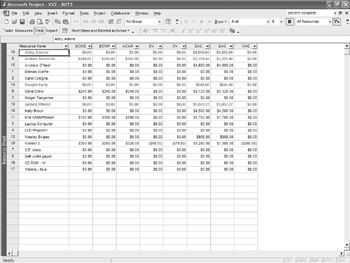
Figure 12.11: Use earned value to analyze resource and assignment performance.
|
|
EAN: 2147483647
Pages: 241