Reviewing Variances from the Baseline
|
|
Whether you are manually updating task data, or using the workgroup tools to have Project update task data based on their responses to your e-mail queries, comparing the actual results with the baseline and interim plan data gives you a lot of information about the status of the project. Project calculates variances to baseline for start and finish dates, duration, work, and costs. You can most easily display these variances by switching to Tracking Gantt view (ViewØTracking Gantt) and then selecting the Variance table (ViewØTableØVariance).
The Tracking Gantt view, shown in Figure 12.7, displays gray bars for the baseline start and finish dates, in addition to the blue or red bars for actual or scheduled start and finish dates (red bars indicate critical path tasks).
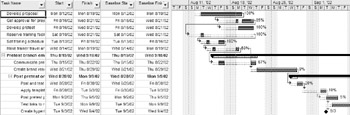
Figure 12.7: The Tracking Gantt shows the difference between baseline and actual dates.
The Variance table, shown in Figure 12.8, contains fields that show the baseline data and variances; you can add additional fields to compare actual and scheduled dates and interim plans. For more about baselines, see “Capturing Baseline Data to Track Progress” in Chapter 11.
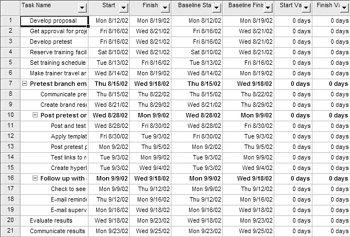
Figure 12.8: Use the Variance table to compare actual and baseline results.
|
|
EAN: 2147483647
Pages: 241