Creating Offline Cubes
As I mentioned earlier in this chapter, Excel can create offline cube files that contain a portion of the OLAP data stored on an OLAP database server. Offline cubes can also contain nonrelational data or relational data. In these cases, when Excel creates the offline cube file, it optimizes the data for analysis using an OLAP-like hierarchy. Offline cubes are effective when you need to package a portion of OLAP data for use when you don’t have a network connection to the OLAP server. You can also create offline cube files to produce highly summarized non-OLAP data for faster performance with PivotTable reports and PivotChart reports.
There are two procedures you can use to create offline cube files in Excel. You follow one set of steps if you want to convert an OLAP cube stored in an OLAP database server to an offline cube file. You use a different procedure if you want to convert nonrelational or relational data into an offline cube file.
| Note | You cannot create an offline cube file from another offline cube file. |
To create an offline cube from OLAP data that resides on an OLAP database server, create a PivotTable report based on the cube using the steps presented earlier in this chapter. Then, on the PivotTable menu, click Offline OLAP. Click Create Offline Data File, and then follow the Create Cube File Wizard to choose the dimensions, levels, and measures that you want to include in your offline cube file. Specify a location for the offline cube file, click Finish, and then click OK in the Offline OLAP Settings dialog box. You can use the resulting .cub file in place of a live connection to an OLAP database server. When you can connect to the OLAP database server again, you can refresh the .cub file with the most recent OLAP data by clicking Refresh Data on the PivotTable menu. You can disconnect your computer from the network again at this point if you need to.
| Note | Refreshing an offline cube file might take a long time, depending on the size of the file. Be sure to allow adequate time and disk space before you try to refresh updated data from an OLAP database server. |
To create an offline cube from nonrelational or relational data, point to Import External Data (Get External Data in Office 2000) on the Data menu and then click New Database Query. After you follow the steps to connect to a data source, select the Create An OLAP Cube From This Query option on the last page of the Query Wizard.
| Note | If you click the Save Query button before you click Finish, you can save your work as a .dqy file so that you can modify your offline cube later without needing to go through all the pages of the Query Wizard. |
In the first step of the OLAP Cube Wizard, you select the fields you want to use as OLAP measures. For each field that you select, you designate a summarization type. In the second step of the wizard, you identify fields that will be used to create OLAP dimensions. You can also specify OLAP levels by dragging fields onto the fields you’ve already designated as dimensions. You can rename any dimension or level without changing the underlying data. In the last step of the wizard, you select an option for building or saving the cube. An offline cube file is stored with the extension .cub. You can then use any of the procedures presented earlier in this chapter to connect to and analyze OLAP data in the offline cube file.
Your Turn
In this exercise, you will create an offline cube file from data in an existing text file and then analyze the data in the offline cube file.
-
In Excel, with a blank worksheet open, point to Import External Data (Get External Data in Office 2000) on the Data menu and then click New Database Query.
-
Select the Use The Query Wizard To Create/Edit Queries option. On the Databases tab, click New Data Source and then click OK.
-
In the What Name Do You Want To Give Your External Data Source box, type Car Sales CSV.
-
In the Select A Driver For The Type Of Database You Want To Access list, select Microsoft Text Driver. Click Connect.
Note If you do not select the Use The Query Wizard To Create/Edit Queries check box in step 2, an application named Microsoft Query appears after step 9 below. Use the Query Wizard when you want to create a simple query, such as you’re doing in this exercise. Use Microsoft Query when you want to create a more complex query. Microsoft Query enables you to narrow your result set by creating advanced query expressions and complex filter criteria. You can also create offline cube files by clicking Create OLAP Cube on the File menu in Microsoft Query. To modify data connection details for an existing data source by using Microsoft Query, on the Data menu, point to Import External Data, and click New Database Query. Make sure the Use The Query Wizard To Create/Edit Queries check box is cleared, click the Databases tab, click an existing data source, and then click OK. For complete information about working with Microsoft Query, click Microsoft Query Help on the Help menu in the Microsoft Query window.
-
Clear the Use Current Directory check box, and then click Select Directory.
-
Locate and select the Chap08 folder.
-
Click OK to close the Select Directory dialog box, and then click OK to close the ODBC Text Setup dialog box.
-
In the Select A Default Table For Your Data Source list, select
 CarSales.csv.
 -
Click OK to close the Create New Data Source dialog box, and then click OK to close the Choose Data Source dialog box.
-
Move the fields in the
CarSales.csv file from the Available Tables And Columns list to the Columns In Your Query list, and then click Next. -
Click Next until you get to the Query Wizard–Finish page, click the Create An OLAP Cube From This Query option, and then click Finish.
-
Click Next on the OLAP Cube Wizard welcome page to display the first step of the OLAP Cube Wizard.
-
Because the Price field is the only field that you will use as a measure, clear the check boxes for the fields in the Source Field list except for the check box next to Price. Compare your results to Figure 8-7, and then click Next.
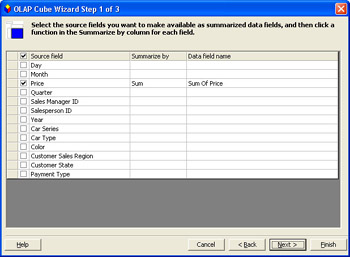
Figure 8-7: The Price field will be the measure in the cube file. -
In the second step of the wizard, you identify the fields you’ll use as dimensions. Drag the following fields from the Source Fields list to the Dimensions list: Car Series, Sales Manager ID, Year, Payment Type, and Customer Sales Region.
-
To create additional levels within the cube’s dimensions, drag the following fields from the Source Fields list to the corresponding dimensions:
-
Drag the Car Type field to the Car Series level.
-
Drag the Color field to the Car Type level.
-
Drag the Salesperson ID field to the Sales Manager ID level.
-
Drag the Quarter field to the Year level.
-
Drag the Month field to the Quarter level.
-
Drag the Day field to the Month level.
-
Drag the Customer State field to the Customer Region level.
-
-
Rename the dimensions by right-clicking the dimension, selecting Rename from the shortcut menu, entering the new name, and pressing Enter. Change the names of the following dimensions:
-
Rename the Car Series dimension to Car Information.
-
Rename the Sales Manager ID dimension to Sales Staff.
-
Rename the Year dimension to Time.
-
Rename the Customer Sales Region dimension to Sales Geography.
-
-
Compare your results to Figure 8-8, and then click Next.
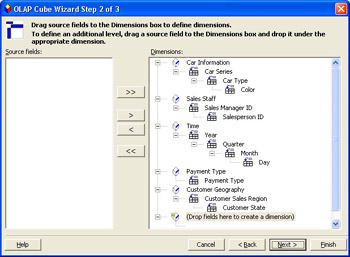
Figure 8-8: Completed details for the second step of the OLAP Cube Wizard, with dimensions and levels selected. -
Select the option Save A Cube File Containing All Data For The Cube, and then click Finish to close the OLAP Cube Wizard.
Note On the last step of the OLAP Cube Wizard, you can select an option to rebuild the offline cube file every time the corresponding PivotTable report is opened and then retrieve the data for the cube all at once or only when you need it. Both of these options ensure that you have the latest data from the underlying data source, but these options can result in much slower performance than the option selected in step 18.
-
Click Save to save the settings as an .oqy file.
-
Click Finish to insert a PivotTable report referencing the new offline cube file. Compare your results to Figure 8-9.
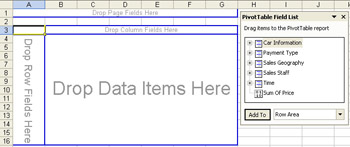
Figure 8-9: The finished PivotTable report, ready for data analysis.
Let’s use the resulting PivotTable report to analyze the data in the offline cube file. For this exercise, let’s quickly determine which state had the most car sales for each year.
-
From the PivotTable field list, drag the Time icon to the Drop Page Fields Here area of the PivotTable report, drag the Sales Geography icon to the Drop Row Fields Here area, and drag the Sum Of Price icon to the Drop Data Items Here area.
-
Click the arrow in the Customer Sales Region field, click the West check box (a double-check symbol appears in the check box), and then click OK. The Customer State field is displayed, showing data for the states in the West sales region.
-
We aren’t concerned with seeing the Customer Sales Region field any more, so right-click the Customer Sales Region field and click Hide Levels. The Customer Sales Region field disappears.
-
In the Time field, click the arrow next to the word All, click the plus sign (+) next to the word All, click 2001, and then click OK. You’ll see that Oregon had the most sales for 2001.
-
In the Time field, click the arrow next to 2001, click 2002, and then click OK. You’ll see that Oregon also had the most sales for 2002.
EAN: 2147483647
Pages: 137