Section 14.3. Debugging the Linux Kernel
14.3. Debugging the Linux KernelOne of the more common reasons you might find yourself stepping through kernel code is to modify or customize the platform-specific code for your custom board. Let's see how this might be done using the AMCC Yosemite board. We place a breakpoint at the platform-specific architecture setup function and then continue until that breakpoint is encountered. Listing 14-4 shows the sequence. Listing 14-4. Debugging Architecture-Setup Code
When the breakpoint at yosemite_setup_arch() is encountered, control passes to gdb at line 308 of yosemite.c. The list (l) command displays the source listing centered on the breakpoint at line 308. The warning message displayed by gdb after the continue (c) command can be safely ignored. It is part of gdb's way of testing the capabilities of the remote system. It first sends a remote continue_with_signal command to the target. The KGDB implementation for this target board does not support this command; therefore, it is NAK'd by the target. gdb responds by displaying this informational message and issuing the standard remote continue command instead. 14.3.1. gdb Remote Serial Protocolgdb includes a debug switch that enables us to observe the remote protocol being used between gdb on your development host and the target. This can be very useful for understanding the underlying protocol, as well as troubleshooting targets that exhibit unusual or errant behavior. To enable this debug mode, issue the following command: (gdb) set debug remote 1With remote debugging enabled, it is instructive to observe the continue command in action and the steps taken by gdb. Listing 14-5 illustrates the use of the continue command with remote debugging enabled. Listing 14-5. continue Remote Protocol Example
Although it might look daunting at first, what is happening here is easily understood. In summary, gdb is restoring all its breakpoints on the target. Recall from Listing 14-3 that we entered two breakpoints, one at panic() and one at sys_sync(). Later in Listing 14-4, we added a third breakpoint at yosemite_setup_arch(). Thus, there are three active user-specified breakpoints. These can be displayed by issuing the gdb info breakpoints command. As usual, we use the abbreviated version.
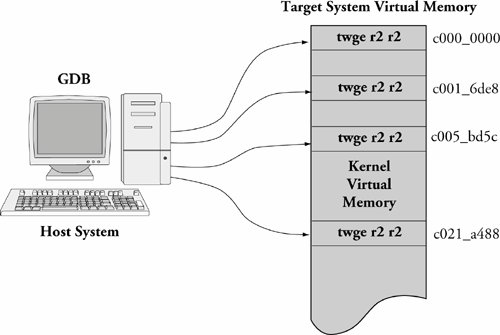
Now compare the previous breakpoint addresses with the addresses in the gdb remote $m packet in Listing 14-5. The $m packet is a "read target memory" command, and the $M packet is a "write target memory" command. Once for each breakpoint, the address of the breakpoint is read from target memory, stored away locally on the host by gdb (so it can be restored later), and replaced with the PowerPC TRap instruction twge r2, r2 (0x7d821008), which results in control passing back to the debugger. Figure 14-4 illustrates this action. Figure 14-4. gdb inserting target memory breakpoints You might have noticed that gdb is updating four breakpoints, whereas we entered only three. The first one at target memory location 0xc000_0000 is put there by gdb automatically upon startup. This location is the base address of the linked kernel image from the ELF fileessentially, _start. It is equivalent to a breakpoint at main() for user space debugging and is done by gdb automatically. The other three breakpoints are the ones we entered earlier. The same thing happens in reverse when an event occurs that returns control to gdb. Listing 14-6 details the action when our breakpoint at yosemite_setup_arch() is encountered. Listing 14-6. Remote Protocol: Breakpoint Hit
The $T packet is a gdb Stop Reply packet. It is sent by the target to gdb when a breakpoint is encountered. In our example, the $T packet returned the value of the program counter and register r1.[4] The rest of the activity is the reverse of that in Listing 14-5. The PowerPC trap breakpoint instructions are removed, and gdb restores the original instructions to their respective memory locations.
14.3.2. Debugging Optimized Kernel CodeAt the start of this chapter, we said that one of the challenges identified in debugging kernel code results from compiler optimization. We noted that the Linux kernel is compiled by default with optimization level -O2. In the examples up to this point, we used -O1 optimization to simplify the debugging task. Here we illustrate one of the many ways optimization can complicate debugging. The related Internet mail lists are strewn with questions related to what appear to be broken tools. Sometimes the poster reports that his debugger is single-stepping backward or that his line numbers do not line up with his source code. Here we present an example to illustrate the complexities that optimizing compilers bring to source-level debugging. In this example, the line numbers that gdb reports when a breakpoint is hit do not match up with the line numbers in our source file due to function inlining. For this demonstration, we use the same debug code snippet as shown in Listing 14-4. However, for this example, we have compiled the kernel with the compiler optimization flag -O2. This is the default for the Linux kernel. Listing 14-7 shows the results of this debugging session. Listing 14-7. Optimized Architecture-Setup Code
Referring back to Listing 14-4, notice that the function yosemite_setup_arch() actually falls on line 306 of the file yosemite.c. Compare that with Listing 14-7. We hit the breakpoint, but gdb reports the breakpoint at file yosemite.c line 116. It appears at first glance to be a mismatch of line numbers between the debugger and the corresponding source code. Is this a gdb bug? First let's confirm what the compiler produced for debug information. Using the readelf[5] tool described in Chapter 13, "Development Tools," we can examine the debug information for this function produced by the compiler.
$ ppc_44x-readelf --debug-dump=info vmlinux | grep -u6 \ yosemite_setup_arch | tail -n 7 DW_AT_name : (indirect string, offset: 0x9c04): yosemite_setup_arch DW_AT_decl_file : 1 DW_AT_decl_line : 307 DW_AT_prototyped : 1 DW_AT_low_pc : 0xc020f41c DW_AT_high_pc : 0xc020f794 DW_AT_frame_base : 1 byte block: 51 (DW_OP_reg1)We don't have to be experts at reading DWARF2 debug records[6] to recognize that the function in question is reported at line 307 in our source file. We can confirm this using the addr2line utility, also introduced in Chapter 13. Using the address derived from gdb in Listing 14-7:
$ ppc_44x-addr2line -e vmlinux 0xc020f41c arch/ppc/platforms/4xx/yosemite.c:307At this point, gdb is reporting our breakpoint at line 116 of the yosemite.c file. To understand what is happening, we need to look at the assembler output of the function as reported by gdb. Listing 14-8 is the output from gdb after issuing the disassemble command on the yosemite_setup_arch() function. Listing 14-8. Disassemble Function yosemite_setup_arch
Once again, we need not be PowerPC assembly language experts to understand what is happening here. Notice the labels associated with the PowerPC bl instruction. This is a function call in PowerPC mnemonics. The symbolic function labels are the important data points. After a cursory analysis, we see several function calls near the start of this assembler listing:
Listing 14-9 reproduces portions of the source file yosemite.c. Correlating the functions we found in the gdb disassemble output, we see those labels occurring in the function yosemite_set_emacdata(), around the line numbers reported by gdb when the breakpoint at yosemite_setup_arch() was encountered. The key to understanding the anomaly is to notice the subroutine call at the very start of yosemite_setup_arch(). The compiler has inlined the call to yosemite_set_emacdata() instead of generating a function call, as would be expected by simple inspection of the source code. This inlining produced the mismatch in the line numbers when gdb hit the breakpoint. Even though the yosemite_set_emacdata() function was not declared using the inline keyword, GCC inlined the function as a performance optimization. Listing 14-9. Portions of Source File yosemite.c
To summarize the previous discussion:
This explains the line numbers reported by gdb when the original breakpoint in yosemite_setup_arch() was hit. Compilers employ many different kinds of optimization algorithms. This example presented but one: function inlining. Each can confuse a debugger (the human and the machine) in a different way. The challenge is to understand what is happening at the machine level and translate that into what we as developers had intended. You can see now the benefits of using the minimum possible optimization level for debugging. 14.3.3. gdb User-Defined CommandsYou might already realize that gdb looks for an initialization file on startup, called .gdbinit. When first invoked, gdb loads this initialization file (usually found in the user's home directory) and acts on the commands within it. One of my favorite combinations is to connect to the target system and set initial breakpoints. In this case, the contents of .gdbinit would look like Listing 14-10. Listing 14-10. Simple gdb Initialization File
This simple .gdbinit file enables the storing of command history in a user-specified file and sets the default output radix for printing of values. Then it defines a gdb user-defined command called connect. (User-defined commands are also often called macros.) When issued at the gdb command prompt, gdb connects to the target system via the desired method and sets the system breakpoints at panic() and sys_sync(). One method is commented out; we discuss this method shortly in Section 14.4. There is no end to the creative use of gdb user-defined commands. When debugging in the kernel, it is often useful to examine global data structures such as task lists and memory maps. Here we present several useful gdb user-defined commands capable of displaying specific kernel data that you might need to access during your kernel debugging. 14.3.4. Useful Kernel gdb MacrosDuring kernel debugging, it is often useful to view the processes that are running on the system, as well as some common attributes of those processes. The kernel maintains a linked list of tasks described by struct task_struct. The address of the first task in the list is contained in the kernel global variable init_task, which represents the initial task spawned by the kernel during startup. Each task contains a struct list_head, which links the tasks in a circular linked list. These two ubiquitous kernel structures are described in the following header files: struct task_struct .../include/linux/sched.h struct list_head .../include/linux/list.h Using gdb macros, we can traverse the task list and display useful information about the tasks. It is easy to modify the macros to extract the data you might be interested in. It is also a very useful tool for learning the details of kernel internals. The first macro we examine (in Listing 14-11) is a simple one that searches the kernel's linked list of task_struct structures until it finds the given task. If it is found, it displays the name of the task. Listing 14-11. gdb find_task Macro
Place this text into your .gdbinit file and restart gdb, or source[7] it using gdb's source command. (We explain the find_next_task macro later in Listing 14-15.) Invoke it as follows:
(gdb) find_task 910 Task "syslogd":or (gdb) find_task 0xCFFDE470 Task "bash":Line 4 defines the macro name. Line 7 decides whether the input argument is a PID (numeric entry starting at zero and limited to a few million) or a task_struct address that must be greater than the end of the Linux kernel image itself, defined by the symbol _end.[8] If it's an address, the only action required is to cast it to the proper type to enable dereferencing the associated task_struct. This is done at line 8. As the comment in line 3 states, this macro returns a gdb convenience variable typecasted to a pointer to a struct task_struct.
If the input argument is a numeric PID, the list is traversed to find the matching task_struct. Lines 12 and 13 initialize the loop variables (gdb does not have a for statement in its macro command language), and lines 15 through 17 define the search loop. The find_next_task macro is used to extract the pointer to the next task_struct in the linked list. Finally, if the search fails, a sane return value is set (the address of init_task) so that it can be safely used in other macros. Building on the find_task macro in Listing 14-11, we can easily create a simple ps command that displays useful information about each process running on the system. Listing 14-12 defines a gdb macro that displays interesting information from a running process, extracted from the struct task_struct for the given process. It is invoked like any other gdb command, by typing its name followed by any required input parameters. Notice that this user-defined command requires a single argument, either a PID or the address of a task_struct. Listing 14-12. gdb Macro: Print Process Information
This ps macro is similar to the find_task macro, except that it requires no input arguments and it adds a macro (task_struct_show) to display the useful information from each task_struct. Line 3 prints a banner line with column headings. Lines 4 through 6 set up the loop and display the first task. Lines 8 through 11 loop through each task, calling the task_struct_show macro for each. Notice also the inclusion of the gdb document command. This allows the gdb user to get help by issuing the help ps command from the gdb command prompt as follows: (gdb) help ps Print points of interest for all tasksListing 14-13 displays the output of this macro on a target board running only minimal services. Listing 14-13. gdb ps Macro Output
The bulk of the work done by this ps macro is performed by the task_struct_show macro. As shown in Listing 14-13, the task_struct_show macro displays the following fields from each task_struct:
It is relatively easy to modify the macro to show the items of interest for your particular kernel debugging task. The only complexity is in the simplicity of the macro language. Because function equivalents such as strlen do not exist in gdb's user-defined command language, screen formatting must be done by hand. Listing 14-14 reproduces the task_struct_show macro that produced the previous listing. Listing 14-14. gdb task_struct_show Macro
Line 3 displays the address of the task_struct. Lines 8 through 12 display the process ID. If this is the current process (the process that was currently running on this CPU at the time the breakpoint was hit), it is marked with a < character. Lines 14 through 39 decode and display the state of the process. This is followed by displaying the user process next instruction pointer (NIP) and the kernel stack pointer (SP). Finally, the device associated with the process is displayed, followed by the name of the process (stored in the ->comm element of the task_struct.) It is important to note that this macro is architecture dependent, as shown in lines 7 and 8. In general, macros such as these are highly architecture- and version-dependent. Any time a change in the underlying structure is made, macros such as these must be updated. However, if you spend a lot of time debugging the kernel using gdb, the payback is often worth the effort. For completeness, we present the find_next_task macro. Its implementation is less than obvious and deserves explanation. (It is assumed that you can easily deduce the task_struct_header that completes the series necessary for the ps macro presented in this section. It is nothing more than a single line arranging the column headers with the correct amount of whitespace.) Listing 14-15 presents the find_next_task macro used in our ps and find_task macros. Listing 14-15. gdb find_next_task Macro
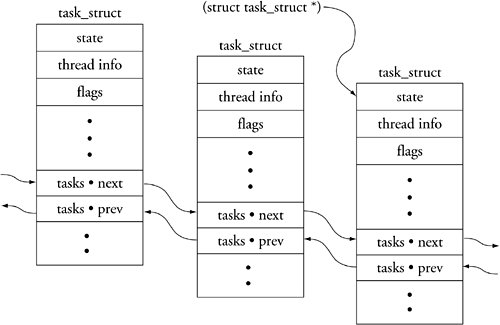
The function performed by this macro is simple. The implementation is slightly less than straightforward. The goal is to return the ->next pointer, which points to the next task_struct on the linked list. However, the task_struct structures are linked by the address of the struct list_head member called tasks, as opposed to the common practice of being linked by the starting address of the task_struct itself. Because the ->next pointer points to the address of the task structure element in the next task_struct on the list, we must subtract to get the address of the top of the task_struct itself. The value we subtract from the ->next pointer is the offset from that pointer's address to the top of task_struct. First we calculate the offset and then we use that offset to adjust the ->next pointer to point to the top of task_struct. Figure 14-5 should make this clear. Figure 14-5. Task structure list linking Now we present one final macro that will be useful in the next section when we discuss debugging loadable modules. Listing 14-16 is a simple macro that displays the kernel's list of currently installed loadable modules. Listing 14-16. gdb List Modules Macro
This simple loop starts with the kernel's global variable module. This variable is a struct list_head that marks the start of the linked list of loadable modules. The only complexity is the same as that described in Listing 14-15. We must subtract an offset from the struct list_head pointer to point to the top of the struct module. This is performed in line 7. This macro produces a simple listing of modules containing the address of the struct module and the module's name. Here is an example of its use: (gdb) lsmod Address Module 0xD1012A80 ip_conntrack_tftp 0xD10105A0 ip_conntrack 0xD102F9A0 loop (gdb) help lsmod List the loaded kernel modules and their start addresses (gdb) Macros such as the ones presented here are very powerful debugging aids. You can create macros in a similar fashion to display anything in the kernel that lends itself to easy access, especially the major data structures maintained as linked lists. Examples include process memory map information, module information, file system information, and timer lists and so on. The information presented here should get you started. 14.3.5. Debugging Loadable ModulesThe most common reason for using KGDB is to debug loadable kernel modules, that is, device drivers. One of the more convenient features of loadable modules is that, under most circumstances, it is not necessary to reboot the kernel for each new debugging session. You can start a debugging session, make some changes, recompile, and reload the module without the hassle and delay of a complete kernel reboot. The complication associated with debugging loadable modules is in gaining access to the symbolic debug information contained in the module's object file. Because loadable modules are dynamically linked when they are loaded into the kernel, the symbolic information contained in the object file is useless until the symbol table is adjusted. Recall from our earlier examples how we invoke gdb for a kernel debugging session: $ ppc_4xx-gdb vmlinuxThis launches a gdb debugging session on your host, and reads the symbol information from the Linux kernel ELF file vmlinux. Of course, you will not find symbols for any loadable modules in this file. Loadable modules are separate compilation units and are linked as individual standalone ELF objects. Therefore, if we intend to perform any source-level debugging on a loadable module, we need to load its debug symbols from the ELF file. gdb provides this capability in its add-symbol-file command. The add-symbol-file command loads symbols from the specified object file, assuming that the module itself has already been loaded. However, we are faced with the chicken-and-egg syndrome. We don't have any symbol information until the loadable module has been loaded into the kernel and the add-symbol-file command is issued to read in the module's symbol information. However, after the module has been loaded, it is too late to set breakpoints and debug the module's *_init and related functions because they have already executed. The solution to this dilemma is to place a breakpoint in the kernel code that is responsible for loading the module, after it has been linked but before its initialization function has been called. This work is done by .../kernel/module.c. Listing 14-17 reproduces the relevant portions of module.c. Listing 14-17. module.c: Module Initialization
We load the module using the modprobe utility, which was demonstrated in Listing 8-5 in Chapter 8, "Device Driver Basics," and looks like this: $ modprobe loopThis command issues a special system call that directs the kernel to load the module. The module loading begins at sys_init_module() in module.c. After the module has been loaded into kernel memory and dynamically linked, control is passed to the module's _init function. This is shown in lines 1906 and 1907 of Listing 14-17. We place our breakpoint here. This enables us to add the symbol file to gdb and subsequently set breakpoints in the module. We demonstrate this process using the Linux kernel's loopback driver called loop.ko. This module has no dependencies on other modules and is reasonably easy to demonstrate. Listing 14-18 shows the gdb commands to initiate this debugging session on loop.ko. Listing 14-18. Initiate Module Debug Session: loop.ko
Starting with line 2, we use the gdb user-defined macro connect created earlier in Listing 14-10 to connect to the target board and set our initial breakpoints. We then add the breakpoint in module.c, as shown in line 7, and we issue the continue command (c). Now the kernel completes the boot process and we establish a telnet session into the target and load the loop.ko module (not shown). When the loopback module is loaded, we immediately hit breakpoint #3. gdb then displays the information shown in lines 14 through 16. At this point, we need to discover the address where the Linux kernel linked our module's .text section. Linux stores this address in the module information structure struct module in the module_core element. Using the lsmod macro we defined in Listing 14-16, we obtain the address of the struct module associated with our loop.ko module. This is shown in lines 17 through 19. Now we use this structure address to obtain the module's .text address from the module_core structure member. We pass this address to the gdb add-symbol-file command, and gdb uses this address to adjust its internal symbol table to match the actual addresses where the module was linked into the kernel. From there, we can proceed in the usual manner to set breakpoints in the module, step through code, examine data, and so on. We conclude this section with a demonstration of placing a breakpoint in the loopback module's initialization function so that we can step through the module's initialization code. The complication here is that the kernel loads the module's initialization code into a separately allocated portion of memory so that it can be freed after use. Recall from Chapter 5, "Kernel Initialization," our discussion of the __init macro. This macro expands into a compiler attribute that directs the linker to place the marked portion of code into a specially named ELF section. In essence, any function defined with this attribute is placed in a separate ELF section named .init.text. Its use is similar to the following: static int __init loop_init(void){...}This invocation would place the compiled loop_init() function into the .init.text section of the loop.ko object module. When the module is loaded, the kernel allocates a chunk of memory for the main body of the module, which is pointed to by the struct module member named module_core. It then allocates a separate chunk of memory to hold the .init.text section. After the initialization function is called, the kernel frees the memory that contained the initialization function. Because the object module is split like this, we need to inform gdb of this addressing scheme to be able to use symbolic data for debugging the initialization function.[9] Listing 14-19 demonstrates these steps.
Listing 14-19. Debugging Module init Code
14.3.6. printk DebuggingDebugging kernel and device driver code using printk is a popular technique, mostly because printk has evolved into a very robust method. You can call printk from almost any context, including from interrupt handlers. printk is the kernel's version of the familiar printf() C library function. printk is defined in .../kernel/printk.c. It is important to understand the limitations of using printk for debugging. First, printk requires a console device. Moreover, although the console device is configured as early as possible during kernel initialization, there are many calls to printk before the console device has been initialized. We present a method to cope with this limitation later, in Section 14.5, "When It Doesn't Boot." The printk function allows the addition of a string marker that identifies the level of severity of a given message. The header file .../include/linux/kernel.h defines eight levels: #define KERN_EMERG "<0>" /* system is unusable */ #define KERN_ALERT "<1>" /* action must be taken immediately */ #define KERN_CRIT "<2>" /* critical conditions */ #define KERN_ERR "<3>" /* error conditions */ #define KERN_WARNING "<4>" /* warning conditions */ #define KERN_NOTICE "<5>" /* normal but significant condition */ #define KERN_INFO "<6>" /* informational */ #define KERN_DEBUG "<7>" /* debug-level messages */ A simple printk message might look like this: printk("foo() entered w/ %s\n", arg);If the severity string is omitted, the kernel assigns a default severity level, which is defined in printk.c. In recent kernels, this is set at severity level 4, KERN_WARNING. Specifying printk with a severity level might look something like this: printk(KERN_CRIT "vmalloc failed in foo()\n"); By default, all printk messages below a predefined loglevel are displayed on the system console device. The default loglevel is defined in printk.c. In recent Linux kernels, it has the value 7. This means that any printk message that is greater in importance than KERN_DEBUG will be displayed on the console. You can set the default kernel loglevel in a variety of ways. At boot time, you can specify the default loglevel on your target board by passing the appropriate kernel command line parameters to the kernel at boot time. Three kernel command line options defined in main.c affect the default loglevel:
Using debug effectively displays every printk message. Using quiet displays all printk messages of severity KERN_ERR or higher. printk messages can be logged to files on your target or via the network. Use klogd (kernel log daemon) and syslogd (system log daemon) to control the logging behavior of printk messages. These popular utilities are described in man pages and many Linux references, and are not described here. 14.3.7. Magic SysReq KeyThis useful debugging aid is invoked through a series of special predefined key sequences that send messages directly to the kernel. For many target architectures and boards, you use a simple terminal emulator on a serial port as a system console. For these architectures, the Magic SysReq key is defined as a break character followed by a command character. Consult the documentation on the terminal emulator you use for how to send a break character. Many Linux developers use the minicom terminal emulator. For minicom, the break character is sent by typing Ctl-A F. After sending the break in this manner, you have 5 seconds to enter the command character before the command times out. This useful kernel tool can be very helpful for development and debugging, but it can also cause data loss and system corruption. Indeed, the b command immediately reboots your system without any notification or preparation. Open files are not closed, disks are not synced, and file systems are not unmounted. When the reboot (b) command is issued, control is immediately passed to the reset vector of your architecture in a most abrupt and stunning manner. Use this powerful tool at your own peril! This feature is well documented in the Linux kernel documentation subdirectory in a file called sysrq.txt. There you find the details for many architectures and the description of available commands. For example, another way to set the kernel loglevel just discussed is to use the Magic SysReq key. The command is a number from 0 through 9, which results in the default loglevel being set to the number of the command. From minicom, press Ctl-A F followed by a number, such as 9. Here is how it looks on the terminal: $ SysRq : Changing Loglevel Loglevel set to 9 Commands can be used to dump registers, shut down your system, reboot your system, dump a list of processes, dump current memory information to your console, and more. See the documentation file in any recent Linux kernel for the details. This feature is most commonly used when something causes your system to lock up. Often the Magic SysReq key provides a way to learn something from an otherwise dead system. |
EAN: 2147483647
Pages: 167