Section 14.4. Hardware-Assisted Debugging
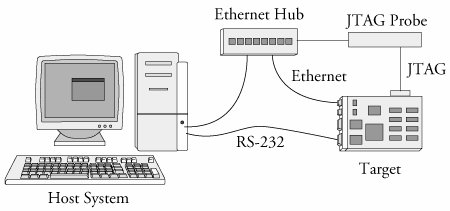
14.4. Hardware-Assisted DebuggingBy now you've probably realized that you cannot debug very early kernel-startup code with KGDB. This is because KGDB is not initialized until after most of the low-level hardware-initialization code has executed. Furthermore, if you are assigned the task of bringing up a brand-new board design and porting a bootloader and the Linux kernel, having a hardware-debug probe is without a doubt the most efficient means of debugging problems in these early stages of board porting. You can choose from a wide variety of hardware-debug probes. For the examples in this section, we use a unit manufactured by Abatron called the BDI-2000 (see www.abatron.ch). These units are often called JTAG probes because they use a low-level communications method that was first employed for boundary scan testing of integrated circuits defined by the Joint Test Action Group (JTAG). A JTAG probe contains a small connector designed for connection to your target board. It is often a simple square-pin header and ribbon cable arrangement. Most modern high-performance CPUs contain a JTAG interface that is designed to provide this software debugging capability. The JTAG probe connects to this CPU JTAG interface. The other side of the JTAG probe connects to your host development system usually via Ethernet, USB, or a parallel port. Figure 14-6 details the setup for the Abatron unit. Figure 14-6. Hardware JTAG probe debugging JTAG probes can be complicated to set up. This is a direct result of the complexity of the CPU to which it is connected. When power is applied to a target board and its CPU comes out of reset, almost nothing is initialized. In fact, many processors need at least a small amount of initialization before they can do anything. Many methods are available for getting this initial configuration into the CPU. Some CPUs read a hardware-configuration word or initial values of specific pins to learn their power-on configuration. Others rely on reading a default location in a simple nonvolatile storage device such as Flash. When using a JTAG probe, especially for bringing up a new board design, a minimum level of CPU and board initialization must be performed before anything else can be done. Many JTAG probes rely on a configuration file for this initialization. The Abatron unit uses a configuration file to initialize the target hardware it is connected to, as well as to define other operational parameters of the debugger. This configuration file contains directives that initialize the CPU, memory system, and other necessary board-level hardware. It is the developer's responsibility to customize this configuration file with the proper directives for his own board. The details on the configuration command syntax can be found in the JTAG probe's documentation. However, only the embedded developer can create the unique configuration file required for a given board design. This requires detailed knowledge of the CPU and board-level design features. Much like creating a custom Linux port for a new board, there is no shortcut or substitute for this task. Appendix F, "Sample BDI-2000 Configuration File," contains a sample Abatron configuration file for a custom board based on the Freescale Semiconductor MPC5200 embedded controller. In that appendix, you can see the necessary setup for a custom board. Notice the liberal use of comments describing various registers and initialization details. This makes it easier to update and maintain over time, and it can help you to get it right the first time. Hardware probes are generally used in two ways. Most have a user interface of some type that enables the developer to use features of the probe. Examples of this are to program Flash or download binary images. The second usage is as a front end to gdb or other source-level debuggers. We demonstrate both usage scenarios. 14.4.1. Programming Flash Using a JTAG ProbeMany hardware probes include the capability to program a wide variety of Flash memory chips. The Abatron BDI-2000 is no exception. The BDI-2000 configuration file includes a [FLASH] section to define the characteristics of the target Flash. Refer to Appendix F for a sample. The [FLASH] section defines attributes of the Flash chip as used in a particular design, such as the chip type, the size of the device, and its data bus width. Also defined are the location in memory and some way to describe the chip's storage organization. When updating one portion of the Flash, you often want to preserve the contents of other portions of the same Flash. In this case, your hardware probe must have some way to limit the sectors that are erased. In the case of the Abatron unit, this is done by adding a line starting with the keyword ERASE for each sector to be erased. When the erase command is issued to the Abatron unit via its telnet user interface, all sectors defined with an ERASE specification are erased. Listing 14-20 demonstrates erasing a portion of Flash on a target board and subsequently programming a new U-Boot bootloader image. Listing 14-20. Erase and Program Flash
First we establish a telnet session to the Abatron BDI-2000. After some initialization, we are presented with a command prompt. When the erase command is issued, the Abatron displays a line of output for each section defined in the configuration file. With the configuration shown in Appendix F, we defined five erase sectors. This reserves up to 256KB of space for the U-Boot bootloader binary. The prog command is shown with all three of its optional parameters. These specify the location in memory where the new image is to be loaded, the name of the image file, and the format of the filein this case, a binary file. You can specify these parameters in the BDI-2000 configuration file. In this case, the command reduces to simply prog without parameters. This example only scratches the surface of these two BDI-2000 commands. Many more combinations of usage and capabilities are supported. Each hardware JTAG probe has its own way to specify Flash erasure and programming capabilities. Consult the documentation for your particular device for the specifics. 14.4.2. Debugging with a JTAG ProbeInstead of interfacing directly with a JTAG probe via its user interface, many JTAG probes can interface with your source-level debugger. By far the most popular debugger supported by hardware probes is the gdb debugger. In this usage scenario, gdb is instructed to begin a debug session with the target via an external connection, usually an Ethernet connection. Rather than communicate directly with the JTAG probe via a user interface, the debugger passes commands back and forth between itself and the JTAG probe. In this model, the JTAG probe uses the gdb remote protocol to control the hardware on behalf of the debugger. Refer again to Figure 14-6 for connection details. JTAG probes are especially useful for source-level debugging of bootloader and early startup code. In this example, we demonstrate the use of gdb and an Abatron BDI-2000 for debugging portions of the U-Boot bootloader on a PowerPC target board. Many processors contain debugging registers that include the capability to set traditional address breakpoints (stop when the program reaches a specific address) as well as data breakpoints (stop on conditional access of a specified memory address). When debugging code resident in read-only memory such as Flash, this is the only way to set a breakpoint. However, these registers are typically limited. Many processors contain only one or two such registers. This limitation must be understood before using hardware breakpoints. The following example demonstrates this. Using a setup such as that shown in Figure 14-6, assume that our target board has U-Boot stored in Flash. When we presented bootloaders in Chapter 7, you learned that U-Boot and other bootloaders typically copy themselves into RAM as soon as possible after startup. This is because hardware read (and write) cycles from RAM are orders of magnitude faster than typical read-only memory devices such as Flash. This presents two specific debugging challenges. First, we cannot modify the contents of read-only memory (to insert a software breakpoint), so we must rely on processor-supported breakpoint registers for this purpose. The second challenge comes from the fact that only one of the execution contexts (Flash or RAM) can be represented by the ELF executable file from which gdb reads its symbolic debugging information. In the case of U-Boot, it is linked for the Flash environment where it is initially stored. The early code relocates itself and performs any necessary address adjustments. This means that we need to work with gdb within both of these execution contexts. Listing 14-21 shows an example of such a debug session. Listing 14-21. U-Boot Debugging Using JTAG Probe
Study this example carefully. Some subtleties are definitely worth taking the time to understand. First, we connect to the Abatron BDI-2000 using the target remote command. The IP address in this case is that of the Abatron unit, represented by the symbolic name bdi.[10] The Abatron BDI-2000 uses port 2001 for its remote gdb protocol connection.
Next we issue a command to the BDI-2000 using the gdb mon command. The mon command tells gdb to pass the rest of the command directly to the remote hardware device. Therefore, mon break hard sets the BDI-2000 into hardware breakpoint mode. We then set a hardware breakpoint at board_init_f. This is a routine that executes while still running out of Flash memory at address 0xfff0457c. After the breakpoint is defined, we issue the continue c command to resume execution. Immediately, the breakpoint at board_init_f is encountered, and we are free to do the usual debugging activities, including stepping through code and examining data. You can see that we have issued the bt command to examine the stack backtrace and the i frame command to examine the details of the current stack frame. Now we continue execution again, but this time we know that U-Boot copies itself to RAM and resumes execution from its copy in RAM. So we need to change the debugging context while keeping the debugging session alive. To accomplish this, we discard the current symbol table (symbol-file command with no arguments) and load in the same symbol file again using the add-symbol-file command. This time, we instruct gdb to offset the symbol table to match where U-Boot has relocated itself to memory. This ensures that our source code and symbolic debugging information match the actual memory resident image. After the new symbol table is loaded, we can add a breakpoint to a location that we know will reside in RAM when it is executed. This is where one of the subtle complications is exposed. Because we know that U-Boot is currently running in Flash but is about to move itself to RAM and jump to its RAM-based copy, we must still use a hardware breakpoint. Consider what happens at this point if we use a software breakpoint. gdb dutifully writes the breakpoint opcode into the specified memory location, but U-Boot overwrites it when it copies itself to RAM. The net result is that the breakpoint is never hit, and we begin to suspect that our tools are broken. After U-Boot has entered the RAM copy and our symbol table has been updated to reflect the RAM-based addresses, we are free to use RAM-based breakpoints. This is reflected by the last command in Listing 14-21 setting the Abatron unit back to soft breakpoint mode. Why do we care about using hardware versus software breakpoints? If we had unlimited hardware breakpoint registers, we wouldn't. But this is never the case. Here is what it looks like when you run out of processor-supported hardware breakpoint registers during a debug session: (gdb) b flash_init Breakpoint 3 at 0x7fbebe0: file flash.c, line 70. (gdb) c Continuing. warning: Cannot insert breakpoint 3: Error accessing memory address 0x7fbebe0: Unknown error 4294967295. Because we are debugging remotely, we aren't told about the resource constraint until we try to resume after entering additional breakpoints. This is because of the way gdb handles breakpoints. When a breakpoint is hit, gdb restores all the breakpoints with the original opcodes for that particular memory location. When it resumes execution, it restores the breakpoint opcodes at the specified locations. You can observe this behavior by enabling gdb's remote debug mode: (gdb) set debug remote 1 |
EAN: 2147483647
Pages: 167